Failing cloudsense fragmented packets test
-
The test is here
http://icmpcheckv6.popcount.org/
I am trying to diagnose why I fail the test, as I understand it, it will fail on NAT'd devices as fragmented packets dont get forwarded, however it also fails if I run the test directly on my pfsense unit, which obviously is not behind a NAT as its the router itself.
To test directly on pfsense you can run this command, it works if I run it on another network e.g. any of my servers in a datcentre but on my home LAN on pfsense after a long delay it times out.
curl -v -s http://icmpcheck.popcount.org/frag -o /dev/null
In terms of my setup, I do run shaping via dummynet. fq_codel config.
My ipv4 MTU is 1500.
Scrub is disabled.
There is no firewall in front of my pfsense firewall.Appreciate any ideas and especially if someone already knows the solution. Occasionally I do come across sites that either dont load or load only after a long unexplained pause and feel this could be related.
Also some more info, I just tested it on a pfsense I got deployed at a datacentre and interestingly that fails as well. But the proxmox host machine hosting it the test passes, so its not the network in that case proven.
-
This passes just fine running through HE tunnel even.
2.4.4-RELEASE][root@sg4860.local.lan]/root: curl -v -s http://icmpcheck.popcount.org/frag -o /dev/null
*   Trying 139.162.188.91...
* TCP_NODELAY set
* Connected to icmpcheck.popcount.org (139.162.188.91) port 80 (#0)
> GET /frag HTTP/1.1
> Host: icmpcheck.popcount.org
> User-Agent: curl/7.62.0
> Accept: */*
>
< HTTP/1.1 200 OK
< Date: Thu, 13 Dec 2018 16:14:23 GMT
< Content-Type: text/plain; charset=utf-8
< Connection: close
< Transfer-Encoding: chunked
<
{ [14 bytes data]
* Closing connection 0
[2.4.4-RELEASE][root@sg4860.local.lan]/root: curl -v -s http://icmpcheckv6.popcount.org/frag -o /dev/null
*   Trying 2a01:7e01::f03c:91ff:fe16:a2e9...
* TCP_NODELAY set
* Connected to icmpcheckv6.popcount.org (2a01:7e01::f03c:91ff:fe16:a2e9) port 80 (#0)
> GET /frag HTTP/1.1
> Host: icmpcheckv6.popcount.org
> User-Agent: curl/7.62.0
> Accept: */*
>
< HTTP/1.1 200 OK
< Date: Thu, 13 Dec 2018 16:14:41 GMT
< Content-Type: text/plain; charset=utf-8
< Connection: close
< Transfer-Encoding: chunked
<
{ [14 bytes data]
* Closing connection 0
[2.4.4-RELEASE][root@sg4860.local.lan]/root:
No special settings on pfsense to get this to pass both ipv4 and ipv6. What exactly are the errors your getting..
Did you take a look at their tcpdump to validate your seeing the frag info..
If you want a drop dead simple solution just turn off IPv6 ;) There are a few here that don't like that solution... But what exact resource are you using that actually "requires" ipv6? Just saying..
-
note it is an ipv4 test, I dont know why they put it on the ipv6 page, check the output of the curl command and its going to 139.162.188.91.
I am kind of shocked at the reply tho, yes I definitely will not be turning off ipv6.
Do you know the tcpdump syntax I need to verify the frag info?
I stated in the OP why I want to fix this, (some unexplained occasions where I get hangs browsing). That as well as my obsessive compulsive disorder not liking things to be broken.
The eventual failure which has zero hits on google is recv failure permission denied..
* Trying 139.162.188.91... * TCP_NODELAY set * Connected to icmpcheck.popcount.org (139.162.188.91) port 80 (#0) > GET /frag HTTP/1.1 > Host: icmpcheck.popcount.org > User-Agent: curl/7.62.0 > Accept: */* > < HTTP/1.1 200 OK < Date: Wed, 12 Dec 2018 21:44:36 GMT < Content-Type: text/plain; charset=utf-8 < Connection: close < Transfer-Encoding: chunked < { [14 bytes data] * Recv failure: Permission denied * Closing connection 0 -
They have 2 pages... Why would you care to be testing ipv4 when you stated your problem is via ipv6..
While I am a fan of IPv6 - its not something that is REQUIRED to use the net... You can think it is all you want... Its just not there yet..
They have the tcpdump listed on the page.. just hit it in your browser and scroll down... What account are you running that as.. what version of pfsense... Looks like you get permission denied?
-
Sorry for the confusion I didnt state its a ipv6 problem but I accept I did link to a ipv6 test page.
But anyway, any suggestions aside from turning off the current gen ip protocol. It is not a ipv6 specific problem.
The tcpdump command provided on their page is invalid, it reports this.
tcpdump: any: No such device exists
-
So are you using IPv6 or not? You do understand that clients will use ipv6, and fall back to IPv4... So you need to validate where your having a problem with only IPv4
" or load only after a long unexplained pause and feel this could be related."
This screams of fallback to IPv4 from IPv6 to me..
edit: You have to call out the actually interface... in the tcpdump command.
Here ipv6 test down my HE tunnel which is on gif0
-
Since you appear confused I will clarify.
We are talking about the failure of this specific command.
curl -v -s http://icmpcheck.popcount.org/frag -o /dev/null
This is an ipv4 hostname and as thus an ipv4 test, zilch to do with ipv6.
I understand this also fails
curl -v -s http://icmpcheckv6.popcount.org/frag -o /dev/null, and that one is a ipv6 test but lets please concentrate on the ipv4 test.
So ipv4 fragments not arriving is the problem at hand.
The sites in question are not ipv6 sites, ipv6 sites load fine e.g. youtube and netflix utilise ipv6. It is not a internet noob not recognising ipv6 to ipv4 fallback delays :) Typically the problematic sites tend to be very old unmaintained sites, no modern sites cause this and indeed the pfsense forum we are on now is loading from ipv6.
Also the Dc install is 2.4.4, my LAN install is 2.4.4-p1
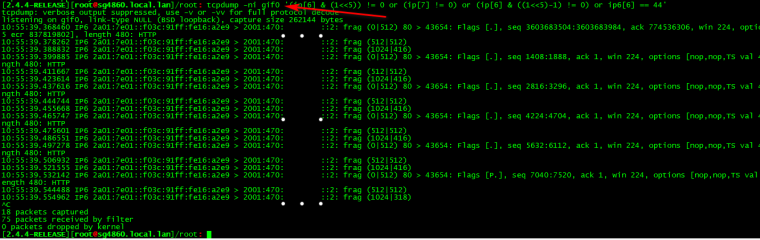
here is output of tcpdump
[2.4.4-RELEASE][admin@pfSense.localdomain]/root: tcpdump -ni vtnet0 '(ip[6] & (1<<5)) != 0 or (ip[7] != 0) or (ip[6] & ((1<<5)-1) != 0) or ip6[6] == 44' tcpdump: verbose output suppressed, use -v or -vv for full protocol decode listening on vtnet0, link-type EN10MB (Ethernet), capture size 262144 bytes 17:01:01.149318 IP 139.162.188.91.80 > 88.198.64.148.9344: Flags [.], seq 1059434196:1059434676, ack 1855695002, win 227, options [nop,nop,TS val 1574322922 ecr 462037901], length 480: HTTP 17:01:01.149345 IP 139.162.188.91 > 88.198.x,x: ip-proto-6 17:01:01.149357 IP 139.162.188.91 > 88.198.x,x: ip-proto-6 17:01:01.180237 IP 139.162.188.91.80 > 88.198.x.x.9344: Flags [.], seq 1448:1928, ack 1, win 227, options [nop,nop,TS val 1574322922 ecr 462037901], length 480: HTTP 17:01:01.180266 IP 139.162.188.91 > 88.198.x.x: ip-proto-6 17:01:01.180279 IP 139.162.188.91 > 88.198.x.x: ip-proto-6 17:01:01.210996 IP 139.162.188.91.80 > 88.198.x.x.9344: Flags [P.], seq 2896:3376, ack 1, win 227, options [nop,nop,TS val 1574322922 ecr 462037901], length 480: HTTP 17:01:01.211026 IP 139.162.188.91 > 88.198.x.x: ip-proto-6 17:01:01.211047 IP 139.162.188.91 > 88.198.x.x: ip-proto-6 17:01:01.246718 IP 139.162.188.91.80 > 88.198.x.x.9344: Flags [.], seq 4096:4576, ack 1, win 227, options [nop,nop,TS val 1574322922 ecr 462037901], length 480: HTTP 17:01:01.246746 IP 139.162.188.91 > 88.198.x.x: ip-proto-6 17:01:01.246757 IP 139.162.188.91 > 88.198.x.x: ip-proto-6 17:01:01.278593 IP 139.162.188.91.80 > 88.198.x.x.9344: Flags [.], seq 5544:6024, ack 1, win 227, options [nop,nop,TS val 1574322922 ecr 462037901], length 480: HTTP 17:01:01.278620 IP 139.162.188.91 > 88.198.x.x: ip-proto-6 17:01:01.278631 IP 139.162.188.91 > 88.198.x.x: ip-proto-6 -
Well you should prob remove the links to the ipv6 test then ;)
Don't see your frag stuff... So you prob have something between you and where your trying to go breaking PMTUD.. This has nothing to do with pfsense.
-
So
In the DC case, pfsense is hosted on proxmox. It has a virtual switch between it and the proxmox host. The proxmox host is fine but the pfsense VM is not.
At home, I have the same problem, but I have no device in front of pfsense to test otherwise, I could I suppose hook up another router but really dont want to do that.
I am not saying I disagree with you, but you jumped to the conclusion very quickly.
-
do the other test
[2.4.4-RELEASE][root@sg4860.local.lan]/root: curl -v -s http://icmpcheck.popcount.org/icmp --data @payload.bin- Trying 139.162.188.91...
- TCP_NODELAY set
- Connected to icmpcheck.popcount.org (139.162.188.91) port 80 (#0)
POST /icmp HTTP/1.1
Host: icmpcheck.popcount.org
User-Agent: curl/7.62.0
Accept: /
Content-Length: 0
Content-Type: application/x-www-form-urlencoded< HTTP/1.1 200 OK
< Date: Thu, 13 Dec 2018 17:09:58 GMT
< Content-Type: text/plain; charset=utf-8
< Connection: close
< Transfer-Encoding: chunked
<
{"msg1": "Upload complete", "mtu":1500, "lost_segs":0, "retrans_segs":0, "total_retrans_segs":0, "reord_segs":3, "snd_mss":1448, "rcv_mss":536}- Closing connection 0
[2.4.4-RELEASE][root@sg4860.local.lan]/root:
As to conclusion quickly - there was a recent thread with issue but with IPv6.. Same urls using, etc.
-
is good
root@PFSENSE tmp # curl -v -s http://icmpcheck.popcount.org/icmp --data @payload.bin
*   Trying 139.162.188.91...
* TCP_NODELAY set
* Connected to icmpcheck.popcount.org (139.162.188.91) port 80 (#0)
> POST /icmp HTTP/1.1
> Host: icmpcheck.popcount.org
> User-Agent: curl/7.62.0
> Accept: */*
> Content-Length: 0
> Content-Type: application/x-www-form-urlencoded
>
< HTTP/1.1 200 OK
< Date: Thu, 13 Dec 2018 17:11:19 GMT
< Content-Type: text/plain; charset=utf-8
< Connection: close
< Transfer-Encoding: chunked
<
{"msg1": "Upload complete", "mtu":1500, "lost_segs":0, "retrans_segs":0, "total_retrans_segs":0, "reord_segs":3, "snd_mss":1420, "rcv_mss":536}
* Closing connection 0
I notice the snd_mss value seems low on my test tho, especially considering I do have a mtu of 1500.
-
what do you get from here?
http://www.letmecheck.it/mtu-test.phpWhat about this test
https://www.speedguide.net/analyzer.php -
The requested URL /mtu-test.php was not found on this server. Their ipv6 vhost is broken I suspect as I am accessing it on ipv6.
speedguide analyzer looks good
TCP options string = 020405b40103030401010402 MTU = 1500 MTU is fully optimized for broadband. MSS = 1460 Maximum useful data in each packet = 1460, which equals MSS. Default TCP Receive Window (RWIN) = 65696 RWIN Scaling (RFC1323) = 4 bits (scale factor: 2^4=16) Unscaled TCP Receive Window = 4106 In Windows 8.1, unless "TCP/IP Auto-Tuning" is disabled, only the Current TCP Window is displayed. Use the latest TCP Optimizer for tweaking. You seem to be using Google Chrome. Note that Chrome can modify the TCP Window for sockets it creates under some OSes, and therefore servers may not get your OS-assigned RWIN value. FAQ RWIN is not fully optimized. The unscaled RWIN value is lower than it should be. Also, RWIN being close to and above 65536 does not justify the header overhead of enabling TCP 1323 Options. You might want to use one of the recommended RWIN values below. RWIN is not multiple of MSS. If your OS supports setting RWIN directly, consider changing it to a multiple of MSS for optimum performance. Other RWIN values that might work well with your current MTU/MSS: 64240 (up to 2 Mbit lines, depending on latency. MSS * 44) 128480 (1-5 Mbit lines, depending on latency. MSS * 44 * 2) 256960 (2-15 Mbit lines, depending on latency. MSS * 44 * 2^2) 513920 (10-30 Mbit lines, depending on latency. MSS * 44 * 2^3) 1027840 (30-100 Mbit lines depending on latency. MSS * 44 * 2^4) bandwidth * delay product (Note this is not a speed test): Your current TCP Window limits you to: 2628 kbps (328 KBytes/s) @ 200ms latency Your current TCP Window limits you to: 1051 kbps (131 KBytes/s) @ 500ms latency MTU Discovery (RFC1191) = ON Time to live left = 118 hops TTL value is ok. Timestamps (RFC1323) = OFF Selective Acknowledgements (RFC2018) = ON IP type of service field (RFC1349) = 00000010 (2) Precedence (priority) = 000 (routine) Delay = 0 (normal delay) Throughput = 0 (normal throughput) Reliability = 0 (normal reliability) Cost = 1 (low cost) Check bit = 0 (correct, 8th checking bit must be zero) DSCP (DiffServ) = CS0 000000 (0) - class 0, default traffic (RFC 2474). -
Ok I set the preference level on my windows desktop for ipv6 below ipv4 and ran the first link again, here is the result.
Sending 32 bytes to 87.81.x,x <- not fragmented Sending 750 bytes to 87.81.x.x <- not fragmented Sending 1125 bytes to 87.81.x.x <- not fragmented Sending 1313 bytes to 87.81.x.x <- not fragmented Sending 1407 bytes to 87.81.x.x <- not fragmented Sending 1454 bytes to 87.81.x.x <- not fragmented Sending 1478 bytes to 87.81.x.x <- FRAGMENTED! Sending 1466 bytes to 87.81.x.x <- not fragmented Sending 1472 bytes to 87.81.x.x <- not fragmented Sending 1475 bytes to 87.81.x.x <- FRAGMENTED! Sending 1473 bytes to 87.81.x.x <- FRAGMENTED! Sending 1472 bytes to 87.81.x.x <- not fragmented From the tests we did, we can assume that 1472 bytes is the largest unfragmented packet size. The MTU size would be 1500, made up from 1472 payload and 28 ICMP/IP Headers and payload information. -
Ok it is fixed on the DC instance now.
I simply enabled scrub again and it works. How strange is that? Considering scrub messes with fragmented packets. So with scrub disabled the frag test fails, are you able to test that?
Same fix works on LAN as well.
Ok glad the cause is found, it is odd, but good nevertherless. thanks :)