idle box, delay on local command line or pkg download
-
Hey folks,
i recently upgraded from 2.4.4 to 2.4.5 and then to 21.02 on both nodes of my cluster (SG-2440). Everything went well but while upgrading i realiaze passive node took double time to complete, either to 2.4.5 and to 21.02 processes. At package download step, it run very slow, line after line, pkg after pkg. When i say slow i mean slow as a vm with no resources available.
Once upgraded i enjoyed a new smooth webUI on active node and a sluggish one on the passive. No error or warning messages, all packages are okay (acme,snort,pfblocker,cron) including ha sync.
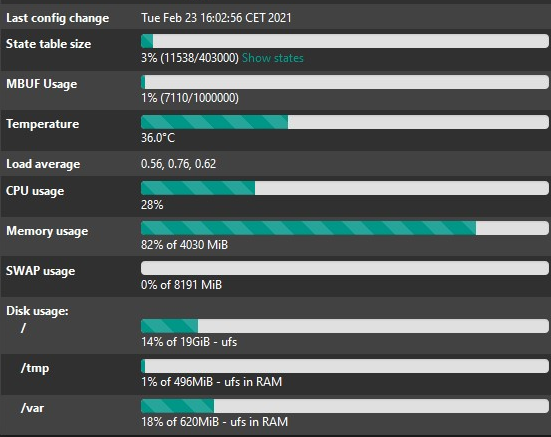
Highest stat as below, so it generally idle with a CPU 10%-12% usage
I then started monitoring cron events like pfblockerNG update and i got this on active node
UPDATE PROCESS ENDED [ 02/23/21 13:04:53 ]and this on passive
UPDATE PROCESS ENDED [ 02/23/21 13:29:25 ]So this overall sluggish behavior also impacts on these cron activities and i don't mean pfblockerNG is the culprit but it just delayed by some main reason.
Actually, it seems to be a pre-existing issue i grabbed with me from past releases, because when it became the active node, network performance are totally unaffected and i did not notice it until direct interaction on recent upgrade process.
I started to taking note of execution times of some simple local command network-related:
active node -> instantaneous response until 8°th hop
/usr/bin/time -p traceroute www.google.com
traceroute to www.google.com (142.250.180.132), 64 hops max, 40 byte packets
 1  2-228-90-17.ip190.fastwebnet.it (2.228.90.17)  0.458 ms  0.406 ms  0.329 ms
 2  93-61-100-1.ip146.fastwebnet.it (93.61.100.1)  8.036 ms  8.093 ms  7.630 ms
 3  10.1.166.65 (10.1.166.65)  8.010 ms  8.124 ms  7.768 ms
 4  10.254.20.129 (10.254.20.129)  7.920 ms
    10.254.20.145 (10.254.20.145)  7.907 ms  8.431 ms
 5  93.57.68.129 (93.57.68.129)  7.668 ms
    93.57.68.98 (93.57.68.98)  7.810 ms
    93.57.68.129 (93.57.68.129)  8.964 ms
 6  62-101-124-1.fastres.net (62.101.124.1)  18.274 ms
    62-101-124-5.fastres.net (62.101.124.5)  18.064 ms
    62-101-124-1.fastres.net (62.101.124.1)  18.288 ms
 7  209.85.168.64 (209.85.168.64)  16.486 ms  17.615 ms  16.564 ms
 8  * * *
 9  142.250.211.34 (142.250.211.34)  18.361 ms
    142.250.211.20 (142.250.211.20)  16.895 ms
    142.250.211.24 (142.250.211.24)  18.094 ms
10  142.250.211.29 (142.250.211.29)  17.879 ms
    142.250.211.31 (142.250.211.31)  17.726 ms  16.988 ms
11  mil04s43-in-f4.1e100.net (142.250.180.132)  16.948 ms  17.372 ms  16.656 ms
real 57.39
user 0.00
sys 0.01
passive node -> slow response till the end
/usr/bin/time -p traceroute www.google.com
traceroute to www.google.com (142.250.184.68), 64 hops max, 40 byte packets
 1  2-228-90-17.ip190.fastwebnet.it (2.228.90.17)  0.427 ms  0.448 ms  0.398 ms
 2  93-61-100-1.ip146.fastwebnet.it (93.61.100.1)  7.581 ms  8.541 ms  9.506 ms
 3  10.1.166.69 (10.1.166.69)  8.110 ms
    10.1.166.65 (10.1.166.65)  7.615 ms
    10.1.166.69 (10.1.166.69)  8.796 ms
 4  10.254.20.129 (10.254.20.129)  8.041 ms  15.940 ms
    10.254.20.145 (10.254.20.145)  8.052 ms
 5  93.57.68.102 (93.57.68.102)  7.888 ms  7.639 ms
    93.57.68.98 (93.57.68.98)  7.778 ms
 6  62-101-124-5.fastres.net (62.101.124.5)  17.270 ms  18.607 ms  17.494 ms
 7  209.85.168.64 (209.85.168.64)  16.851 ms  17.629 ms  17.757 ms
 8  * * *
 9  108.170.245.65 (108.170.245.65)  18.353 ms  18.695 ms  17.409 ms
10  108.170.245.89 (108.170.245.89)  16.123 ms
    108.170.245.83 (108.170.245.83)  17.036 ms
    108.170.245.66 (108.170.245.66)  17.498 ms
11  74.125.245.241 (74.125.245.241)  17.632 ms  17.754 ms  16.806 ms
12  142.251.50.139 (142.251.50.139)  16.524 ms
    142.251.50.141 (142.251.50.141)  16.241 ms
    142.251.50.139 (142.251.50.139)  16.952 ms
13  mil41s03-in-f4.1e100.net (142.250.184.68)  15.659 ms  15.676 ms  16.763 ms
real 182.08
user 0.00
sys 0.03
So, comparing real values, it is 182/57 and I would like to understand if that depend on some misconfiguration / hardware issue like disk access or so.
any tips are welcome,
Thanks in advance