DNS Resolution issues
-
Kinda weird one. I have a box with 2.5.1 (didn't realize 2.5.2 was out so I'll be updating it later today) that can resolve locally but not remotely. If I putty into the box and do a dig on the VLAN10 IP it resolves right away. If I try from a PC on VLAN 10 there is no response from the unbound server. I can packet capture and see the requests coming in with nothing being sent back out. For now I just have DHCP assigning QuadDNS IPs so they are up for the moment. I'll be back out there in about 4 hours. Here's what I've tried:
- Maybe unbound wasn't configured properly on the interface to resolve? Things appear correct in the config screen. Also found that by running "dig yahoo.com x.x.x.x" from the command line it resolved immediately.
- Maybe PC can't reach the firewall IP? Able to both ping x.x.x.x and log into the pfSense interface on x.x.x.x.
- Maybe it's being filtered in the firewall? Nothing in the logs points to that.
- Maybe it's that VLAN? Doesn't work on either a native port or a VLAN. Just no response but I can see the requests in a packet capture on the firewall.
Not sure what to make of it. I rebooted and it worked at first and then stopped. I've had issues with the DNS on 2.5.0 and 2.5.1 and have been able to work around them but none of the other boxes did this. Any ideas? Is this an issue that is likely to be resolved by updating to 2.5.2?
-
@stewart Perhaps the unbound process stopped. I have a watchdog on mine to restart it automatically if it stops unexpectedly which it has done in the past.
Service_Watchdog is in packages.
-
@vmb That's something else I checked but if the process had stopped then running dig against the interface IP wouldn't work.
-
Just wanted to follow up and say that after the upgrade DNS is working properly again. I'll be so glad once I don't have to worry about DNS issues again on these units. We've only upgraded a handful from the 2.4 branch to the 2.5 branch because of it. Sure hope 2.5.2 is finally stable enough to get everything upgraded to without issues. Here's to hoping!
-
Just installed a brand new unit at another location yesterday with 2.5.2 and having the exact same issue. It ran yesterday afternoon just fine but, come this morning, same problems. I can run Dig against the LAN interface from putty and it works just fine. If I run an nslookup from any other device on the network it times out about 90% of the time. Occasionally it will resolve but most of the time it won't. I've created a firewall rule to log the requests and I can see them passing. How can I go about troubleshooting this. It's incredibly frustrating.
Update: I've been fighting with it for 2 hours now. Suddenly it's resolving, most of the time. Still moments when it doesn't resolve.
Update 2: Nope, not resolving any more. It just comes and goes however it wants it seems.
-
If you restart the router does it work?
Do you have DHCP set to register leases in DNS? That will restart unbound at every registration.
-
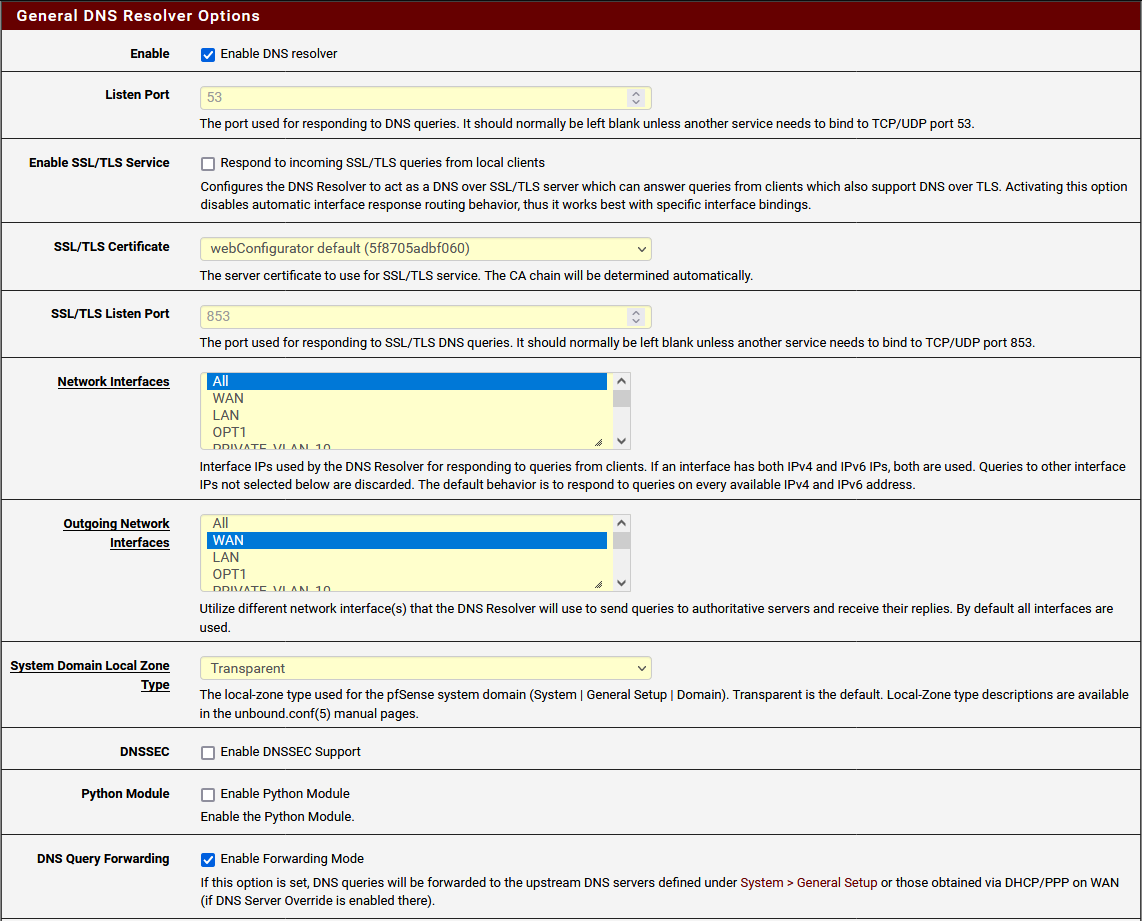
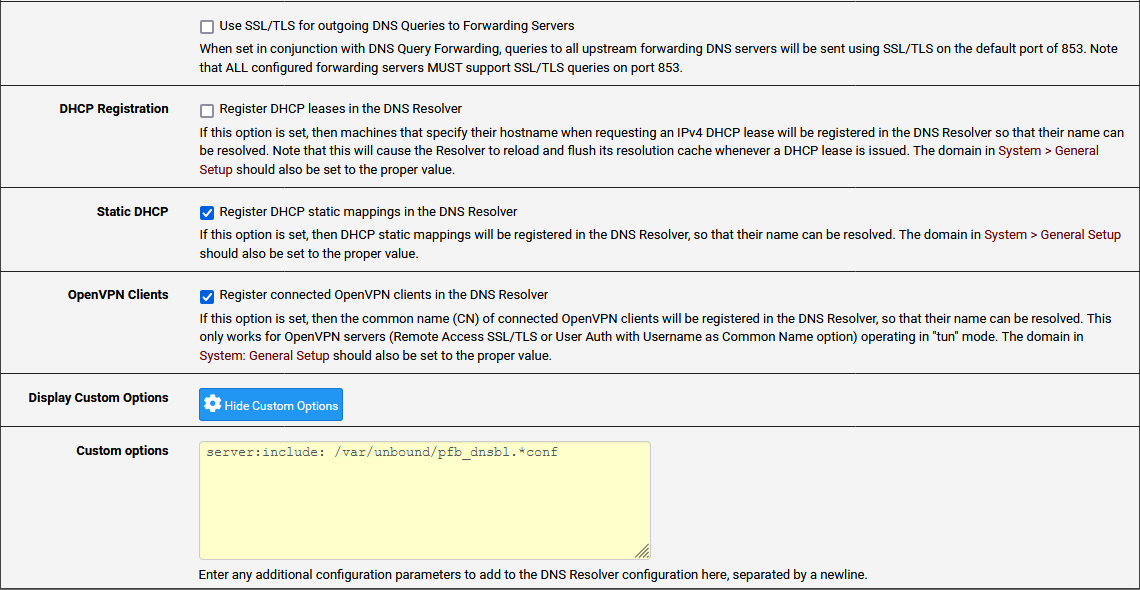
@steveits Restarting the router did not help. I'm including my DNS Settings. The box for DHCP registration is unchecked.
-
Your forwarding not resolving - where are you forwarding too? And you have pfblocker, is it restarting your dns..
Do you have a lot of vpn clients connecting - which you are registering which could restart..
-
I switched to forwarding during the troubleshooting. Having it as resolving appears to be messing up the modem. I'm guessing PUMA. No VPN users. It's a church with half a dozen people and VBS going on right now. That's it. It'll see most of its use on Sundays at this point.
I do see unbound restarting every couple of minutes in the logs. How do I know if pfBlocker is doing it or what is triggering it?
Jul 15 12:16:20 unbound 52438 [52438:0] notice: Restart of unbound 1.12.0. Jul 15 12:16:20 unbound 52438 [52438:0] info: 0.065536 0.131072 1 Jul 15 12:16:20 unbound 52438 [52438:0] info: 0.032768 0.065536 5 Jul 15 12:16:20 unbound 52438 [52438:0] info: lower(secs) upper(secs) recursions Jul 15 12:16:20 unbound 52438 [52438:0] info: [25%]=0.0425984 median[50%]=0.0524288 [75%]=0.0622592 Jul 15 12:16:20 unbound 52438 [52438:0] info: histogram of recursion processing times Jul 15 12:16:20 unbound 52438 [52438:0] info: average recursion processing time 0.057228 sec Jul 15 12:16:20 unbound 52438 [52438:0] info: server stats for thread 3: requestlist max 2 avg 0.5 exceeded 0 jostled 0 Jul 15 12:16:20 unbound 52438 [52438:0] info: server stats for thread 3: 10 queries, 4 answers from cache, 6 recursions, 0 prefetch, 0 rejected by ip ratelimiting Jul 15 12:16:20 unbound 52438 [52438:0] info: 0.262144 0.524288 1 Jul 15 12:16:20 unbound 52438 [52438:0] info: 0.131072 0.262144 1 Jul 15 12:16:20 unbound 52438 [52438:0] info: 0.065536 0.131072 1 Jul 15 12:16:20 unbound 52438 [52438:0] info: 0.032768 0.065536 4 Jul 15 12:16:20 unbound 52438 [52438:0] info: lower(secs) upper(secs) recursions Jul 15 12:16:20 unbound 52438 [52438:0] info: [25%]=0.047104 median[50%]=0.06144 [75%]=0.16384 Jul 15 12:16:20 unbound 52438 [52438:0] info: histogram of recursion processing times Jul 15 12:16:20 unbound 52438 [52438:0] info: average recursion processing time 0.108373 sec Jul 15 12:16:20 unbound 52438 [52438:0] info: server stats for thread 2: requestlist max 3 avg 0.857143 exceeded 0 jostled 0 Jul 15 12:16:20 unbound 52438 [52438:0] info: server stats for thread 2: 10 queries, 3 answers from cache, 7 recursions, 0 prefetch, 0 rejected by ip ratelimiting Jul 15 12:16:20 unbound 52438 [52438:0] info: 0.032768 0.065536 5 Jul 15 12:16:20 unbound 52438 [52438:0] info: lower(secs) upper(secs) recursions Jul 15 12:16:20 unbound 52438 [52438:0] info: [25%]=0.04096 median[50%]=0.049152 [75%]=0.057344 Jul 15 12:16:20 unbound 52438 [52438:0] info: histogram of recursion processing times Jul 15 12:16:20 unbound 52438 [52438:0] info: average recursion processing time 0.052337 sec Jul 15 12:16:20 unbound 52438 [52438:0] info: server stats for thread 1: requestlist max 3 avg 1.8 exceeded 0 jostled 0 Jul 15 12:16:20 unbound 52438 [52438:0] info: server stats for thread 1: 5 queries, 0 answers from cache, 5 recursions, 0 prefetch, 0 rejected by ip ratelimiting Jul 15 12:16:20 unbound 52438 [52438:0] info: 0.131072 0.262144 2 Jul 15 12:16:20 unbound 52438 [52438:0] info: 0.032768 0.065536 6 Jul 15 12:16:20 unbound 52438 [52438:0] info: lower(secs) upper(secs) recursions Jul 15 12:16:20 unbound 52438 [52438:0] info: [25%]=0.0436907 median[50%]=0.0546133 [75%]=0.065536 Jul 15 12:16:20 unbound 52438 [52438:0] info: histogram of recursion processing times Jul 15 12:16:20 unbound 52438 [52438:0] info: average recursion processing time 0.068668 sec Jul 15 12:16:20 unbound 52438 [52438:0] info: server stats for thread 0: requestlist max 0 avg 0 exceeded 0 jostled 0 Jul 15 12:16:20 unbound 52438 [52438:0] info: server stats for thread 0: 11 queries, 3 answers from cache, 8 recursions, 0 prefetch, 0 rejected by ip ratelimiting Jul 15 12:16:17 unbound 52438 [52438:0] info: service stopped (unbound 1.12.0). Jul 15 12:15:16 unbound 52438 [52438:0] info: start of service (unbound 1.12.0). Jul 15 12:15:16 unbound 52438 [52438:0] notice: init module 0: iterator Jul 15 12:14:17 unbound 52438 [52438:0] notice: Restart of unbound 1.12.0. Jul 15 12:14:17 unbound 52438 [52438:0] info: server stats for thread 3: requestlist max 0 avg 0 exceeded 0 jostled 0 Jul 15 12:14:17 unbound 52438 [52438:0] info: server stats for thread 3: 0 queries, 0 answers from cache, 0 recursions, 0 prefetch, 0 rejected by ip ratelimiting Jul 15 12:14:16 unbound 52438 [52438:0] info: server stats for thread 2: requestlist max 0 avg 0 exceeded 0 jostled 0 Jul 15 12:14:16 unbound 52438 [52438:0] info: server stats for thread 2: 0 queries, 0 answers from cache, 0 recursions, 0 prefetch, 0 rejected by ip ratelimiting Jul 15 12:14:16 unbound 52438 [52438:0] info: server stats for thread 1: requestlist max 0 avg 0 exceeded 0 jostled 0 Jul 15 12:14:16 unbound 52438 [52438:0] info: server stats for thread 1: 0 queries, 0 answers from cache, 0 recursions, 0 prefetch, 0 rejected by ip ratelimiting Jul 15 12:14:16 unbound 52438 [52438:0] info: server stats for thread 0: requestlist max 0 avg 0 exceeded 0 jostled 0 Jul 15 12:14:16 unbound 52438 [52438:0] info: server stats for thread 0: 0 queries, 0 answers from cache, 0 recursions, 0 prefetch, 0 rejected by ip ratelimiting Jul 15 12:14:12 unbound 52438 [52438:0] info: service stopped (unbound 1.12.0). Jul 15 12:13:59 unbound 52438 [52438:0] info: start of service (unbound 1.12.0). Jul 15 12:13:59 unbound 52438 [52438:0] notice: init module 0: iterator Jul 15 12:13:00 unbound 52438 [52438:0] notice: Restart of unbound 1.12.0. Jul 15 12:13:00 unbound 52438 [52438:0] info: 0.524288 1.000000 1 Jul 15 12:13:00 unbound 52438 [52438:0] info: 0.262144 0.524288 2 Jul 15 12:13:00 unbound 52438 [52438:0] info: 0.131072 0.262144 1 Jul 15 12:13:00 unbound 52438 [52438:0] info: 0.065536 0.131072 2 Jul 15 12:13:00 unbound 52438 [52438:0] info: 0.032768 0.065536 2 Jul 15 12:13:00 unbound 52438 [52438:0] info: lower(secs) upper(secs) recursions Jul 15 12:13:00 unbound 52438 [52438:0] info: [25%]=0.065536 median[50%]=0.131072 [75%]=0.393216 Jul 15 12:13:00 unbound 52438 [52438:0] info: histogram of recursion processing times Jul 15 12:13:00 unbound 52438 [52438:0] info: average recursion processing time 0.208964 sec Jul 15 12:13:00 unbound 52438 [52438:0] info: server stats for thread 3: requestlist max 1 avg 0.2 exceeded 0 jostled 0 Jul 15 12:13:00 unbound 52438 [52438:0] info: server stats for thread 3: 34 queries, 29 answers from cache, 5 recursions, 0 prefetch, 0 rejected by ip ratelimiting Jul 15 12:13:00 unbound 52438 [52438:0] info: 0.524288 1.000000 1 Jul 15 12:13:00 unbound 52438 [52438:0] info: 0.262144 0.524288 2 Jul 15 12:13:00 unbound 52438 [52438:0] info: 0.131072 0.262144 2 Jul 15 12:13:00 unbound 52438 [52438:0] info: 0.065536 0.131072 4 Jul 15 12:13:00 unbound 52438 [52438:0] info: 0.032768 0.065536 3 Jul 15 12:13:00 unbound 52438 [52438:0] info: lower(secs) upper(secs) recursions Jul 15 12:13:00 unbound 52438 [52438:0] info: [25%]=0.065536 median[50%]=0.114688 [75%]=0.262144 Jul 15 12:13:00 unbound 52438 [52438:0] info: histogram of recursion processing times Jul 15 12:13:00 unbound 52438 [52438:0] info: average recursion processing time 0.164380 sec Jul 15 12:13:00 unbound 52438 [52438:0] info: server stats for thread 2: requestlist max 0 avg 0 exceeded 0 jostled 0 Jul 15 12:13:00 unbound 52438 [52438:0] info: server stats for thread 2: 41 queries, 32 answers from cache, 9 recursions, 0 prefetch, 0 rejected by ip ratelimiting Jul 15 12:13:00 unbound 52438 [52438:0] info: 0.262144 0.524288 4 Jul 15 12:13:00 unbound 52438 [52438:0] info: 0.131072 0.262144 1 Jul 15 12:13:00 unbound 52438 [52438:0] info: 0.032768 0.065536 2 Jul 15 12:13:00 unbound 52438 [52438:0] info: lower(secs) upper(secs) recursions Jul 15 12:13:00 unbound 52438 [52438:0] info: [25%]=0.06144 median[50%]=0.294912 [75%]=0.4096 Jul 15 12:13:00 unbound 52438 [52438:0] info: histogram of recursion processing times Jul 15 12:13:00 unbound 52438 [52438:0] info: average recursion processing time 0.198921 sec Jul 15 12:13:00 unbound 52438 [52438:0] info: server stats for thread 1: requestlist max 0 avg 0 exceeded 0 jostled 0 Jul 15 12:13:00 unbound 52438 [52438:0] info: server stats for thread 1: 15 queries, 12 answers from cache, 3 recursions, 0 prefetch, 0 rejected by ip ratelimiting Jul 15 12:13:00 unbound 52438 [52438:0] info: 2.000000 4.000000 1 Jul 15 12:13:00 unbound 52438 [52438:0] info: 0.262144 0.524288 2 Jul 15 12:13:00 unbound 52438 [52438:0] info: 0.131072 0.262144 1 Jul 15 12:13:00 unbound 52438 [52438:0] info: 0.065536 0.131072 3 Jul 15 12:13:00 unbound 52438 [52438:0] info: 0.032768 0.065536 6 Jul 15 12:13:00 unbound 52438 [52438:0] info: lower(secs) upper(secs) recursions Jul 15 12:13:00 unbound 52438 [52438:0] info: [25%]=0.0505173 median[50%]=0.0764587 [75%]=0.229376 Jul 15 12:13:00 unbound 52438 [52438:0] info: histogram of recursion processing times Jul 15 12:13:00 unbound 52438 [52438:0] info: average recursion processing time 0.325991 sec Jul 15 12:13:00 unbound 52438 [52438:0] info: server stats for thread 0: requestlist max 0 avg 0 exceeded 0 jostled 0 Jul 15 12:13:00 unbound 52438 [52438:0] info: server stats for thread 0: 41 queries, 28 answers from cache, 13 recursions, 0 prefetch, 0 rejected by ip ratelimiting Jul 15 12:12:57 unbound 52438 [52438:0] info: service stopped (unbound 1.12.0). Jul 15 12:10:32 unbound 52438 [52438:0] info: start of service (unbound 1.12.0). Jul 15 12:10:32 unbound 52438 [52438:0] notice: init module 0: iterator Jul 15 12:09:31 unbound 52438 [52438:0] notice: Restart of unbound 1.12.0. -
@stewart said in DNS Resolution issues:
I do see unbound restarting every couple of minutes in the logs.
Well that is going to cause issues with dns ;) It shouldn't be restarting.. If I look at mine
[21.05-RELEASE][admin@sg4860.local.lan]/root: unbound-control -c /var/unbound/unbound.conf status
version: 1.12.0
verbosity: 2
threads: 4
modules: 2 [ validator iterator ]
uptime: 554253 seconds
options: control(ssl)
unbound (pid 63106) is running...
[21.05-RELEASE][admin@sg4860.local.lan]/root:
Its been up for 554253 seconds or about 6.5 days.. And last time it restarted is me playing with it for some other thread most likely and restarting it on purpose.
-
@johnpoz Yeah. I see it's restarting. Just don't know why. I'm removing pfBlocker now to see if it's causing it.
-
@stewart Yup. Since removing pfBlocker, no more restarts.
-
Do you have it updating every few minutes or something? I have pfblocker installed.. but not using dnsbl - I just use it to manage some lists (mostly geoip) that I use in my rules..
-
@johnpoz said in DNS Resolution issues:
@stewart said in DNS Resolution issues:
I do see unbound restarting every couple of minutes in the logs.
Well that is going to cause issues with dns ;) It shouldn't be restarting.. If I look at mine
Could be related to This Report.
I just ran into this on my systems and it has been driving me crazy.
s
-
@swixo So I deinstalled pfBlockerNG and was hopeful that it would make that firewall stable again, but within half an hour I was getting watchdog restarting unbound frequently and eventually 100% packet loss on a couple of interfaces.
After taking some time examining my configuration in detail, I found three settings that had been checked by habit, not by reason. Many years ago, I may have had an actual reason to check mark the settings but I have long since forgotten why.
In menu 'System', submenu 'Advanced', tab 'Networking' there are three check boxes to disable hardware processing on the network adapters. I figured that kernel drivers have improved a lot since the days of NDIS drivers in FreeBSD, so I unchecked them all. I have allowed my NICs to do Checksum, TCP Segmentation and Large Receive Offloading all in hardware.
The system has been running for a day now without a glitch.
I'm on 2.6.0 but it is worth trying on 2.5.2 .
I am going to wait a week or so before reinstalling pfBlockerNG.