SG 1100 runaway memory usage
-
Hello,
I am at a loss as to what is going on with my
SG 1100 (1GB) Release 21.05.1"Normal" memory usage seems to be around 23%
Every couple of days it balloons up to 93% and is
unusable until a reboot.There are NO packages installed, and everything
is "stock". No rules, no nothing, I am just getting
started with pFsense.I would suspect some type of memory leak?
and would appreciate any suggestions for resolution
as the reason I bought the SG1100 was to USE some
packages (Suricata)Thanks
-
Hi,
Ask it to show you a list with all processes, the biggest 'memory user' at the top.
top -o sizeIf it's 'pcscd', locate this image on this page :
Click it, enter 'pcscd', click again and you'll find a solution.
-
@csfshore pscsd will be disabled by default in 21.09 which should be out shortly since they have published the release notes. If you don't use IPSec you can just stop the service for now, or there's a patch to disable it properly.
-
@steveits Thanks for reply.
No pscsd process. php-fpm is "top" with 104M
(Also I wouldn't expect IPSec to be running as
I am all "vanilla"? Plugged it it, it worked. Whew.)However, it is the memory racing that prohibits
me from experimenting with more functionality. -
@csfshore I typo'd it... it's the pcscd Gertjan mentioned. Status/Services:
pcscd PC/SC Smart Card DaemonThat's a known gradual memory leak. If it's something else you'll have to spot it I'm afraid, since that behavior isn't normal.
-
@steveits OK thanks.
Any idea how I would go about tracking it down?
Just continue to monitor via top?
-
If it is the pcscd issue you will see it in the top output.
I would just apply the patch to disable it though. You do not need that running anyway.
https://redmine.pfsense.org/issues/11933#note-7Steve
-
@stephenw10 Thanks but no pcscd visible.
-
But RAM usage is visibly increasing somewhere?
-
@stephenw10 Yes. Over a period of a week? or so it
goes from usual 21-23% to 93%. The first time it
happened I thought it was something I did, but again
"vanilla" install with to packages installed.It's a residential install with about 400 MB of traffic a day
-
@csfshore NO packages installed
-
So it spikes suddenly from 25% to 93%?
Check the Status > Monitorng Graphs.
Steve
-
@stephenw10 Processes 131
(But I must confess, I don't know what I'm looking at)
-
Change that graph to System > Memory. Like:
If you have a leak it will be ramping up slowly.
Steve
-
@stephenw10 Ah brilliant! Got it, thanks
-
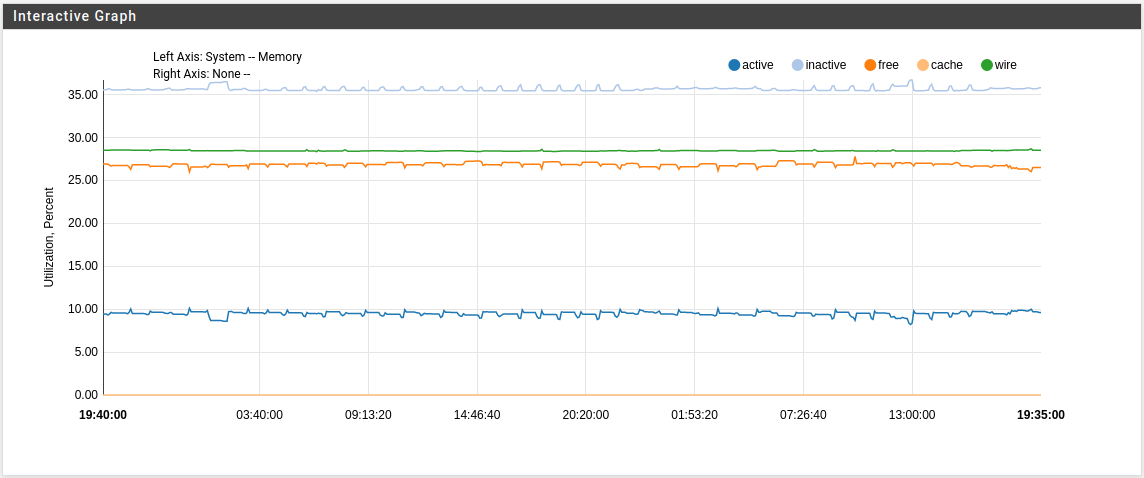
@csfshore This is what I look like, and it was around 9am when I had to reboot as I was at 93% utilized
I'll keep watching this
-
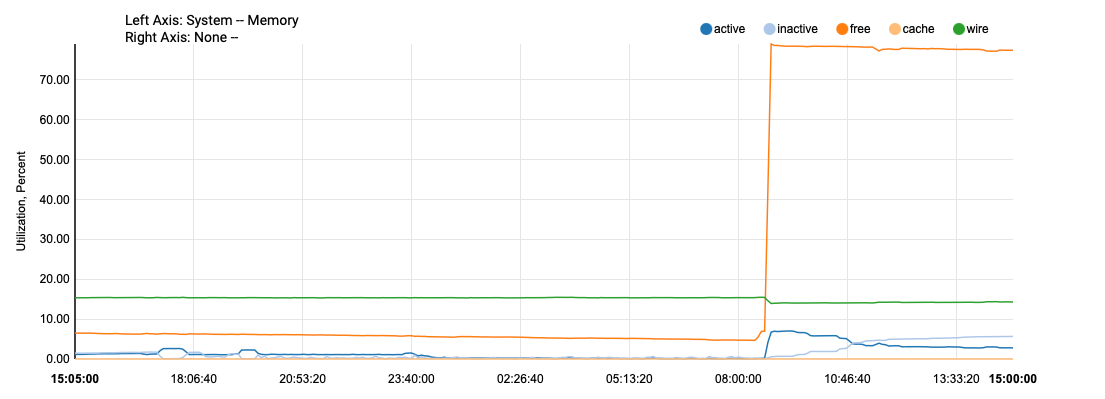
Hmm, not ideal!
So free memory just drops slowly over some days? You can change the time base to see it more clearly.
And services actually fail when it gets that low? Anything logged?Steve
-
@stephenw10 I don't know what to look for in the logs.
Since my posted graph, free memory is (gently)
trending downward.I'm not sure if any services actually fail. However, once
memory usage gets to 93%, I can't access the network.I will keep an eye on the graph, and as a rough estimate
in about a week, system will be unusable without a reboot.Any guidance as to what to look for most appreciated.
Appreciate your responses. Thanks -
If things stop responding I would expect some pretty obvious errors in the logs.
It could be that it stops logging entirely however.
Steve
-
@stephenw10 OK, I'll look there, thanks