2.1->2.1.2 Upgrade -Traffic Graph, NTP Jitter, and Base load
-
Intro. I installed a fresh 2.1 x64 image only a few months back, all has been well. I have not messed with any config files or system tunables. I have iperf, mtr-nox11, and Unbound packages installed.
First things first. PHP seems to like using a lot of CPU all the time now.
last pid: 2677; load averages: 0.24, 0.42, 0.23 up 0+00:04:01 00:29:23
135 processes: 5 running, 102 sleeping, 28 waitingMem: 99M Active, 26M Inact, 176M Wired, 1240K Cache, 48M Buf, 7507M Free
Swap:PID USERNAME PRI NICE SIZE RES STATE C TIME WCPU COMMAND
11 root 171 ki31 0K 64K CPU3 3 3:36 100.00% [idle{idle: cpu3}]
11 root 171 ki31 0K 64K CPU0 0 3:44 97.17% [idle{idle: cpu0}]
11 root 171 ki31 0K 64K RUN 2 3:25 96.88% [idle{idle: cpu2}]
11 root 171 ki31 0K 64K RUN 1 3:20 92.48% [idle{idle: cpu1}]
42449 root 76 0 151M 44532K ppwait 0 0:12 8.06% /usr/local/bin/php{php}
37884 root 52 0 147M 39212K piperd 1 0:07 3.27% /usr/local/bin/php
12 root -32 - 0K 448K WAIT 0 0:01 0.78% [intr{swi4: clock}]
65983 root 45 0 6868K 1252K select 3 0:02 0.59% /usr/sbin/powerd -b adp -a adp
0 root -16 0 0K 304K sched 2 0:38 0.00% [kernel{swapper}]
297 root 76 20 6908K 1356K kqread 3 0:24 0.00% /usr/local/sbin/check_reload_status
69021 root 44 0 6964K 1592K select 1 0:01 0.00% /usr/sbin/syslogd -s -c -c -l /var/dhcpd/va
30177 root 44 0 26268K 6176K kqread 1 0:01 0.00% /usr/local/sbin/lighttpd -f /var/etc/lighty
22142 root 44 0 5780K 1056K piperd 2 0:00 0.00% logger -t pf -p local0.info
21974 root 44 0 11748K 2868K bpf 2 0:00 0.00% /usr/sbin/tcpdump -s 256 -v -S -l -n -e -tt
2 root -8 - 0K 16K - 0 0:00 0.00% [g_event]
7360 root 76 0 8296K 1740K wait 1 0:00 0.00% /bin/sh /usr/local/bin/unbound_monitor.sh
6944 unbound 44 0 69156K 28448K kqread 1 0:00 0.00% /usr/pbi/unbound-amd64/sbin/unbound -c /usr
24577 root 44 0 5784K 1440K select 1 0:00 0.00% /usr/local/sbin/apinger -c /var/etc/apinger–------------------------------------------------
In this image, you will see a blip of green before Fri 18:00, which is PFSense upgrading. You will notice that after the install, there is a lot of blue just constantly lingering.

–-------------------------
Next up, NTPD jitter. I must admit, I've only recently installed NTPD, but for a day before the 2.1.2 upgrade, I was getting jitter numbers in the single digits, and many times lower(fractional milliseconds). As you can see, now they're high double digits, and many times triple.
Status Server Ref ID Stratum Type When Poll Reach Delay ▾ Offset Jitter
Outlier 209.x.x.x 50.23.152.218 3 u 30 64 3 1.196 -69.350 84.414
Unreach/Pending 209.244.0.5 10.64.14.39 2 u 32 64 1 11.183 -97.913 99.792
Outlier 50.31.2.213 128.10.19.24 2 u 45 64 37 13.543 -172.38 58.050
Outlier 208.53.158.34 164.244.221.197 2 u 16 64 7 13.555 -153.55 56.561
Active Peer 216.171.120.36 .ACTS. 1 u 21 64 3 13.582 -72.626 85.490My actual pings are just fine. Here's a ping result from a server outside my ISP. As you can see, jitter is relatively low.
Packets: sent=174, rcvd=174, error=0, lost=0 (0.0% loss) in 86.511710 sec
RTTs in ms: min/avg/max/dev: 11.532 / 13.223 / 77.869 / 5.141
Bandwidth in kbytes/sec: sent=0.120, rcvd=0.120
Next up, WAN traffic graph. It seems to be double counting. You can see in the below image that the WAN outgoing is pretty much 2x the LAN incoming. Edit: noticed something else, the outgoing on the LAN seems to be 2x the incoming on the WAN. It seems the WAN outgoing is 2x the LAN incoming and the WAN incoming is 1/2 the LAN outgoing.
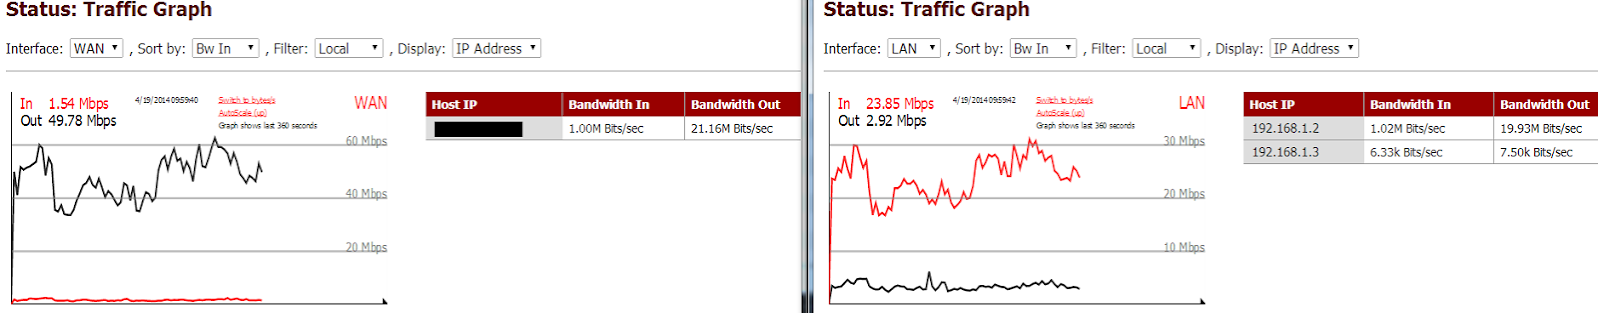
In this next image, you will see that RRD agrees with the LAN side, but not the WAN side.

All in all, the RRD graphs seem unaffected, I don't need NTPD, and the higher PHP load is just causing my CPU to hang around 600mhz instead of 200mhz, so a bit more power usage. My actual Internet seems unaffected.
The only thing that seemed strange was when PFSense came back up, both my wife and I had it twice where we suddenly lost connection, yet my browser session to PFSense was unaffected and apinger didn't show any loss. Not only that, but we couldn't reconnect immediately, we had to wait a few seconds before the Internet started working again. Nothing showed up in the logs. I had ping running on my computer against an outside server and I was getting responses back from PFSense saying "Destination net unreachable", but PFSense worked just fine to the outside.
Another interesting thing to note. My switch shows that my WAN port received a frame error. 3 months of no error at all on any ports and within 3 minutes of PFSense coming up, I lose Internet and a frame error occurs, then a bit later, I lose Internet again and another frame error occurs. Intel NIC driver changes? But like I said, the RRD quality graph shows 0% packet-loss, and nothing shows up in any logs.
As for the hardware
3.2 i5 Haswell Quad, 8GB of memory, Intel i350-T2
I can't wait for 2.2. I would think the PHP high CPU and the traffic graph double counting would be easy bugs to fix, but I think I just jinxed it. Personally, I'm not holding my breath for a 2.1.x fix, I think everyone just wants 2.2.
-
My WAN and LAN graphs have flipped now. WAN is correct and LAN is incorrect. Same other issue where one value is 2x the other and the other is 1/2. I haven't made any changes at all and haven't reset.
edit: Seems that why I was typing this, I refreshed the page to get two graphs in sync and the WAN is now incorrect again and the LAN is correct.
edit2: Looks like my base CPU usage subsided after nearly 24 hours of hanging around 8%. No idea what PHP was doing, but it's done and has been done for the past day.
-
After noticing my system CPU usage was down, I watched my NTP jitter. That seems all good again.
It seems PFSense fixed itself after running for 24 hours. The only outstanding issue is the WAN outgoing reporting 2x the actual amount and the WAN incoming reporting 1/2 the actual amount.
edit:
Yay, Jitter is back to normal again
Selected 209.x.x.x 162.243.55.105 3 u 29 64 377 1.478 -1.749 0.600
Outlier 209.244.0.6 10.67.8.18 3 u 65 64 377 12.039 -0.403 0.696
Outlier 128.105.39.11 128.105.201.11 2 u 2 64 377 49.896 -11.091 0.972
Outlier 128.105.38.11 128.105.201.11 2 u 50 64 377 49.211 -11.121 2.675
Outlier 128.105.37.11 128.105.201.11 2 u 47 64 377 49.368 -10.912 1.211
Active Peer 216.171.120.36 .ACTS. 1 u 49 64 377 13.628 -3.247 0.671
Candidate 50.31.2.213 128.10.19.24 2 u 16 64 377 12.441 -1.414 0.119
Outlier 128.104.30.17 139.78.135.14 2 u 29 64 377 48.801 -10.162 1.673
Outlier 144.92.20.100 139.78.135.14 2 u 60 64 377 48.671 -9.590 0.817
Selected 144.92.104.20 127.67.113.92 2 u 6 64 377 48.729 -11.678 1.041
Selected 208.75.89.4 43.77.130.254 2 u 18 64 377 71.296 7.188 0.561
Selected 199.182.221.110 216.228.192.69 2 u 6 64 377 61.763 -2.985 0.564
Outlier 205.233.73.201 64.246.132.14 2 u 44 64 377 27.726 -1.919 0.310
Candidate 206.108.0.131 .PPS. 1 u 63 64 377 27.035 -1.284 0.769 -
I'm also seeing my doubling of my traffic graphs. I'm dual-wan, and I see my LAN traffic as double of the sum of the WAN interfaces. However, this only applies to the dashboard real-time graphs. The RRD graphs appear to be correct.
No issues with system load or NTP.
-
In case it helps, it looks like what ever the graph scaling uses is the correct value. As you can see, this graph is not scaling correctly because it doesn't see 100mb, it only see 50mb, yet the graph renders it as 100mb.

I've had this happen several times now, and only when the graph is doubling the value.
Another note. I've seen the "base load" issue come and go several times now. PHP seemingly randomly starts using 8% of my CPU for a nice chunk of time(15+ minutes), then stops. It spends much more time being idle than at 8%
-
Next up, NTPD jitter. I must admit, I've only recently installed NTPD, but for a day before the 2.1.2 upgrade, I was getting jitter numbers in the single digits, and many times lower(fractional milliseconds). As you can see, now they're high double digits, and many times triple.
Status Server Ref ID Stratum Type When Poll Reach Delay ▾ Offset Jitter
Outlier 209.x.x.x 50.23.152.218 3 u 30 64 3 1.196 -69.350 84.414
Unreach/Pending 209.244.0.5 10.64.14.39 2 u 32 64 1 11.183 -97.913 99.792
Outlier 50.31.2.213 128.10.19.24 2 u 45 64 37 13.543 -172.38 58.050
Outlier 208.53.158.34 164.244.221.197 2 u 16 64 7 13.555 -153.55 56.561
Active Peer 216.171.120.36 .ACTS. 1 u 21 64 3 13.582 -72.626 85.490NTPD clock jitter is high here because ntpd has not been running very long: the number of samples is too low for the jitter calculation to be meaningful. Look at the first one for example: it will be read again in 30 seconds, it's polled every 64 sec, it's been queried twice with two valid replies. The 'Reach' field is an octal value, and every valid response from the server will shift the value and set the LS bit. Sequence, from startup to 8 valid replies is 0, 1, 3, 7, 17, 37, 77, 177, 377. So, you want to see 377 for all the reach fields, meaning the last 8 queries had valid replies, and you have good data to estimate jitter. Anything else means you have network or serial port clock issues, or you haven't waited long enough.
My actual pings are just fine. Here's a ping result from a server outside my ISP. As you can see, jitter is relatively low.
Packets: sent=174, rcvd=174, error=0, lost=0 (0.0% loss) in 86.511710 sec
RTTs in ms: min/avg/max/dev: 11.532 / 13.223 / 77.869 / 5.141
Bandwidth in kbytes/sec: sent=0.120, rcvd=0.120Though similar in concept, don't expect ping mdev and ntpd jitter to be the same.
Best ntpd results can be had fairly easily with a serial port and a cheap gps, as long as you take care to use PPS (ax +/- 5 uS reported offset and jitter)
[edit: typo]
-
Thanks for more of an explication of how it works, I'm going to have to re-read it a few more times. What I don't get is why is stayed with these high jitters for 24-48 hours. Mind you, I was running 2.1 just the day before and only just enabled NTPD and had single digit jitter in less than a hour. Since I'm already running 2.1.2, I can't repeat the test.
-
I think I figured out the errors reported on my switch. I enabled EEE on my switch and it seems my Intel i350 is the only NIC that actually supports EEE. There seems to be a correlation between my error count incrementing and the ports being idle. This would explain why I saw a few errors on my ports shortly after restarting PFSense from the upgrade, no traffic.
Recently, my ISP did an upgrade late at night, and my switched showed the ports going up an down a few times because they turn off when no traffic and an EEE device is plugged in. The next morning, I saw 2 more errors.
I can't get a causational link, but it seems highly correlated. Even after 9 days of uptime, I only have 5 total errors and they were only spotted shortly after something would have caused WAN traffic to cease.