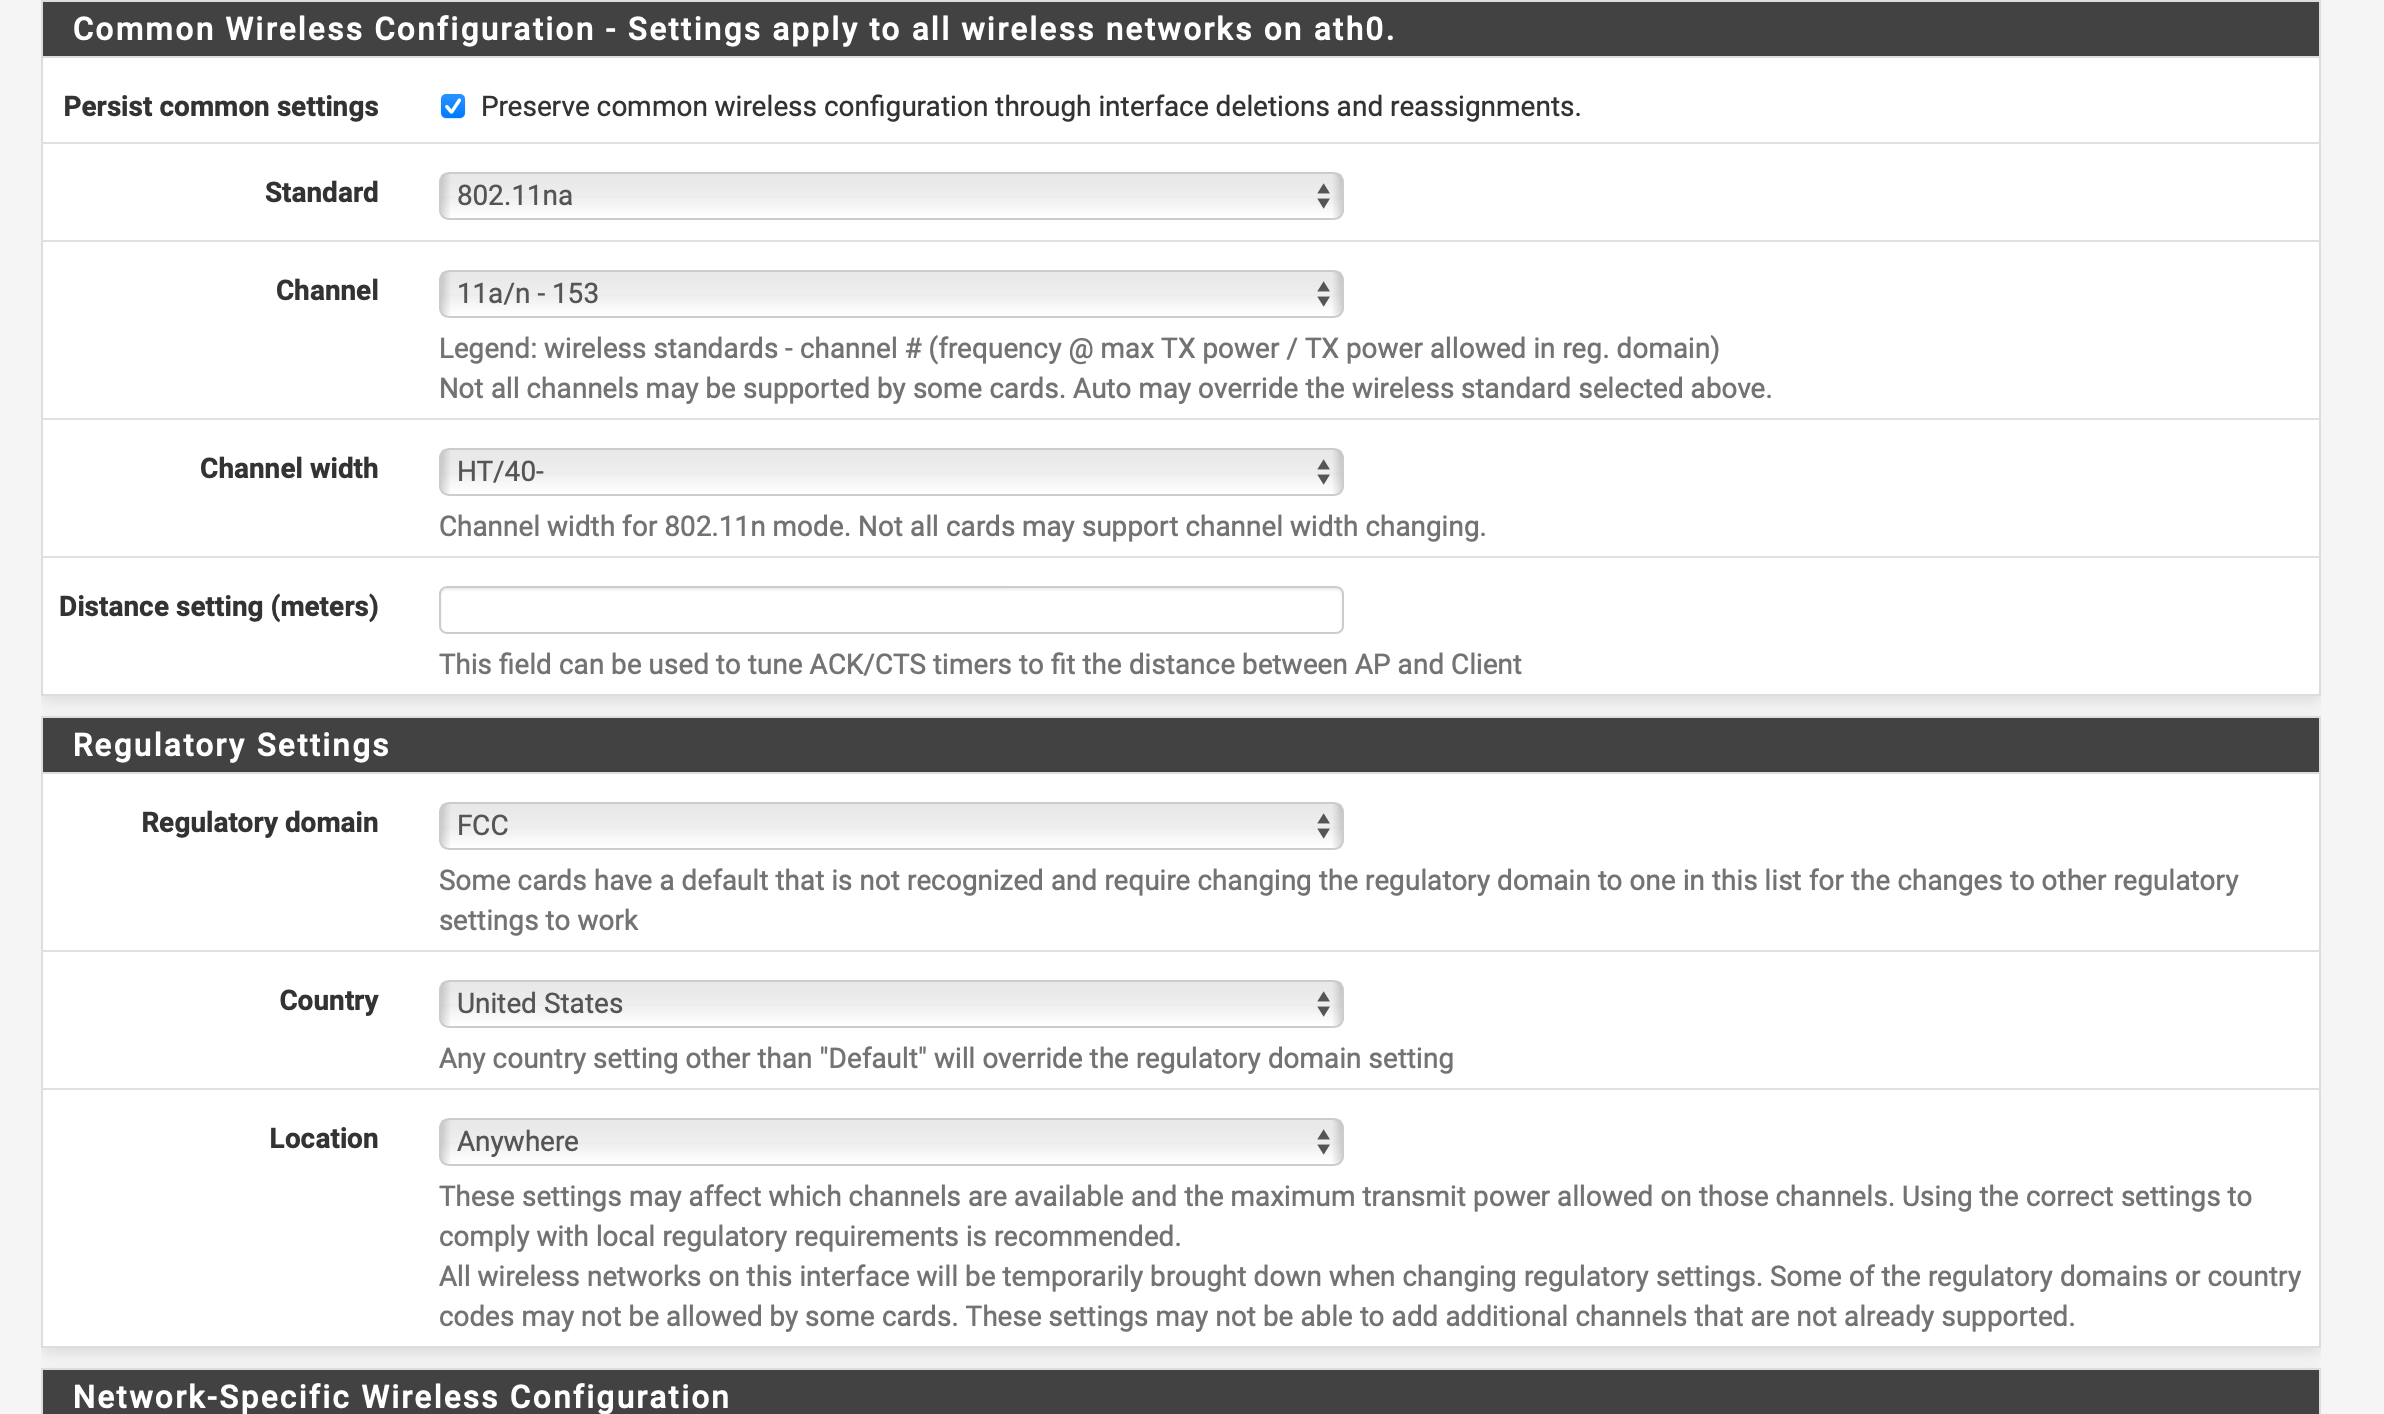
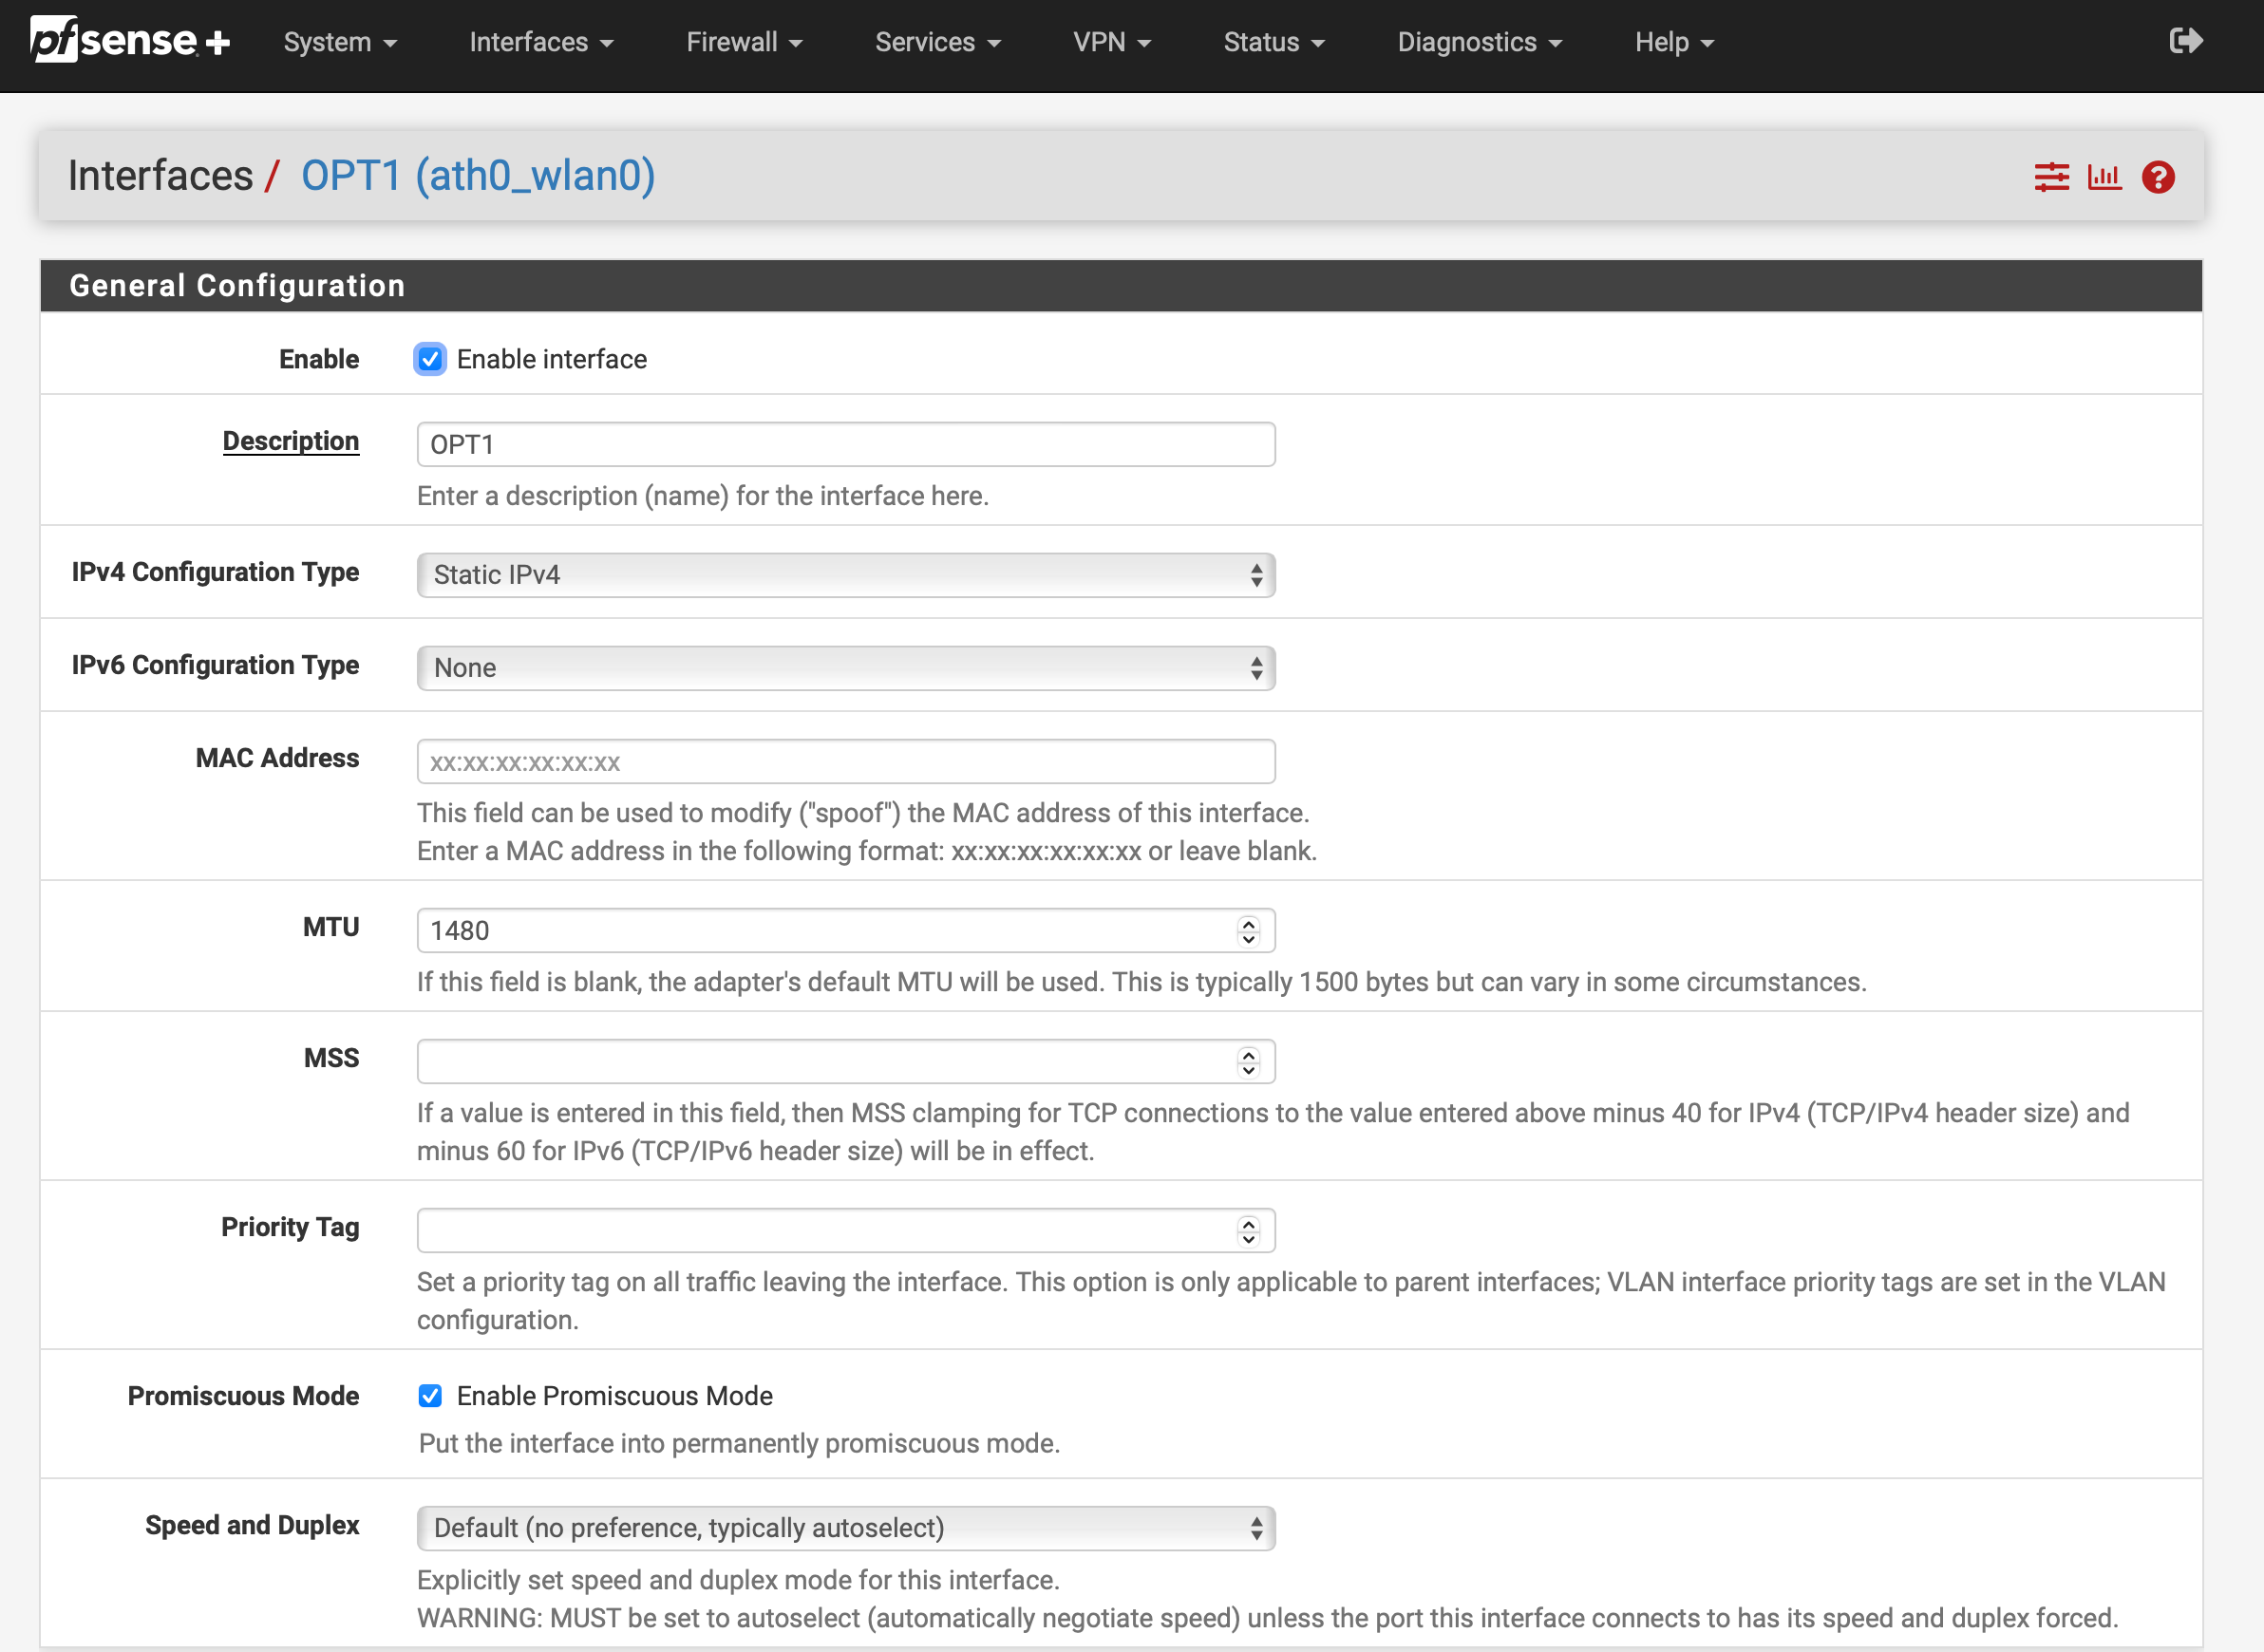
Compex WLE200NX and MTU questions
-
@stephenw10 it just says Boot on the logs nothing shows. Once it showed an error like it lost connection to the card itself. Keep in mind it has never ran full tilt before, so with gigabit fiber it’s now full tilt. I can’t find anything in the logs other than<boot> when it occurs
-
Then I would attach a console to it and log that until it next reboots. See if it shows anything there.
-
@stephenw10
Here it is again with a brand new cardWerid once the system went full tilt it started this.
Changed from 6meg over to 1gbs fiber and this started
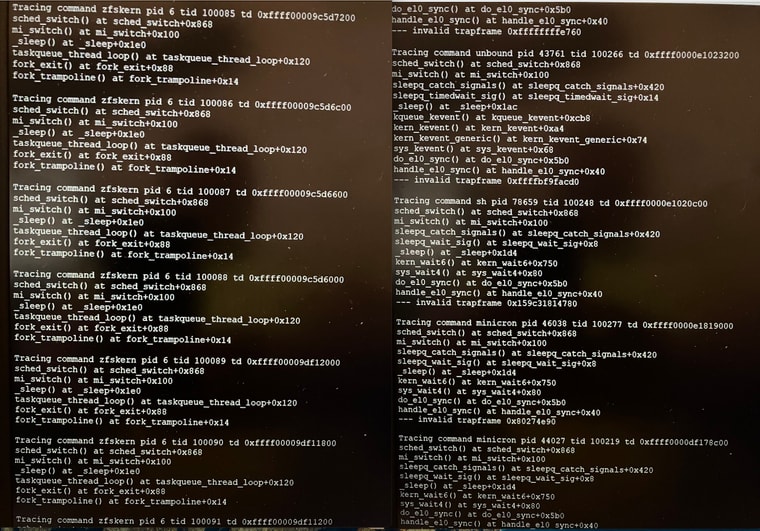
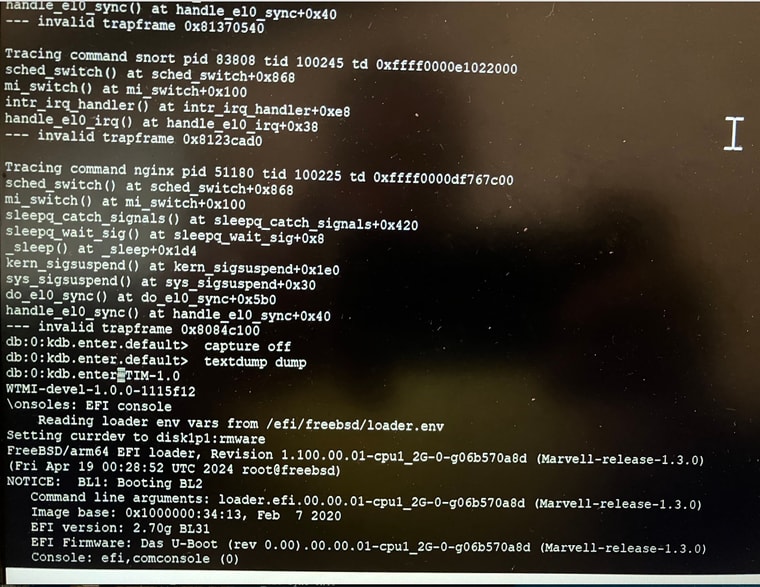
How do I fix this?
-
Tracing command zfskern pid 6 tid 100085 td 0xffff00009c5d7200
switch () at sched switch+0x868
_switch () at mi_switch+0x100
sleep () at
Easkqueue
sleep+0x1e0
fork exith at fork exit+Ox88
thread_100p() at taskqueue_thread 100p+0x120
fork
_trampoline() at fork_trampoline+0x14Does this a ton after reboots
I think it is IRQ related for the that card this is with a new card also
Only occurs with use of XBOX one on the card and it has to be using disney plus for this to occur
-
Maybe this was causing it as it is not attached to the marvel switch however is still being processed at the kernel with unknown items into the que and irqs?
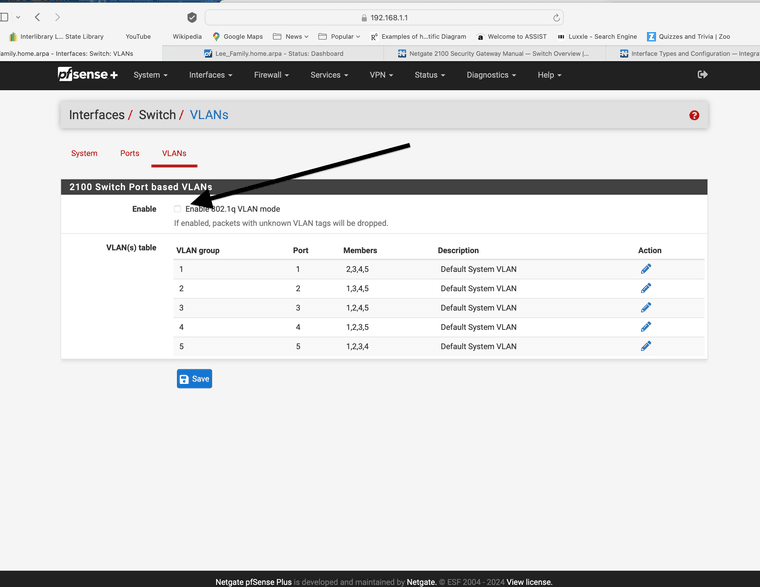
I must have turned this on at one time is this a problem if you use the card?
-
Nope vlan didn’t fix it did it again even with an older ssd card also with different configurations. Xbox starts Disney plus and it going into reboot land.
-
I bet it’s my LED bash program causing memory issues I deleted the cron jobs and Disney is running
-
x0: 0 x1: ffff00009c600000 ($d.6 + 999bb068) x2: 84 x3: 4 x4: 1 x5: ffff000097280840 ($d.6 + 9463b8a8) x6: 0 x0: 0 x7: 100 x1: ffff00009c600000 x8: ffff000000ad0114 ($d.6 + 999bb068) (generic_bs_r_4 + 0) x2: 80f4 x9: ffff000000acff6c x3: 4 (generic_bs_barrier + 0) x4: 1 x10: 88 x5: ffff000096fdd000 x11: 5c0 ($d.6 + 94398068) x12: 1 x13: 1 x6: 100 x14: 285f x7: ffff00009723684c x15: 2af8 ($d.6 + 945f18b4) x16: 2878 x17: 0 x8: ffff000000ad0114 x18: ffff000097280850 (generic_bs_r_4 + 0) ($d.6 + 9463b8b8) x9: ffff000000acff6c x19: ffff000096feb000 (generic_bs_barrier + 0) ($d.6 + 943a6068) x10: 3e8 x20: ffff00009c600000 x11: 10624dd3 ($d.6 + 999bb068) x12: 64 x21: 84 x13: 0 x22: ffff00000213aa80 x14: 186a0 (memmap_bus + 0) x15: 8003bed3 x23: ffff00009c236a74 x16: ffffa00025b97200 ($d.6 + 995f1adc) x24: ffffa000019efc80 x17: ffffa0000275019a x25: 0 x26: 0 x18: ffff0000403c0770 x27: ffff000002192e98 ($d.6 + 3d77b7d8) (Giant + 18) x19: ffff000096feb000 x28: ffffa000019efc80 ($d.6 + 943a6068) x20: ffff00009c600000 x29: ffff000097280850 ($d.6 + 999bb068) ($d.6 + 9463b8b8) x21: 80f4 sp: ffff000097280850 x22: ffff00000213aa80 lr: ffff000000167114 (memmap_bus + 0) (ath_hal_reg_read + cc) x23: ffff000096fef544 elr: ffff000000ad0118 ($d.6 + 943aa5ac) (generic_bs_r_4 + 4) x24: ffff000096feb000spsr: 45 ($d.6 + 943a6068) far: ffff00009c600084 x25: ffff000096fef544 ($d.6 + 999bb0ec) ($d.6 + 943aa5ac) x26: 0 x27: 7530 x28: 754a x29: ffff0000403c0770 ($d.6 + 3d77b7d8) sp: ffff0000403c0770 lr: ffff000000167114 (ath_hal_reg_read + cc) elr: ffff000000ad0118 (generic_bs_r_4 + 4) spsr: 20000045 far: ffff00009c6080f4 ($d.6 + 999c315c) timeout stopping cpus panic: Unhandled EL1 external data abort cpuid = 1 time = 1714888984 KDB: enter: panic [ thread pid 12 tid 100070 ] Stopped at kdb_enter+0x44: undefined f907c27f db:0:kdb.enter.default> textdump set textdump set db:0:kdb.enter.default> capture on db:0:kdb.enter.default> run pfs db:1:pfs> bt Tracing pid 12 tid 100070 td 0xffff00009c22c600 db_trace_self() at db_trace_self db_stack_trace() at db_stack_trace+0x11c db_command() at db_command+0x358 db_script_exec() at db_script_exec+0x1a4 db_command() at db_command+0x358 db_script_exec() at db_script_exec+0x1a4 db_script_kdbenter() at db_script_kdbenter+0x58 db_trap() at db_trap+0xf4 kdb_trap() at kdb_trap+0x284 handle_el1h_sync() at handle_el1h_sync+0x10 --- exception, esr 0 $d.6() at 0xffff000097000a63 db:1:pfs> show registers spsr 0x600000c5 x0 0x12 x1 0xa x2 0x4 x3 0xa x4 0xffff000000ad0244 generic_bs_w_4 x5 0x50 x6 0xffff00000067adec kvprintf+0x470 x7 0xd5 x8 0x1 x9 0x9f067a1c30d67fd2 x10 0xffff0000023d9000 nfsheur+0x5480 x11 0xfefefefefefefeff x12 0xffff000097000a63 x13 0xfeff00ff0100 x14 0 x15 0 x16 0 x17 0 x18 0xffff000097280560 x19 0xffff000002433000 epoch_array+0x1280 x20 0xffff000002401eb0 vpanic.buf x21 0xffff00009c22c600 x22 0 x23 0xffff000002401000 proc_id_reapmap+0x2870 x24 0xffffa000019efc80 x25 0 x26 0 x27 0xffff000002192e98 Giant+0x18 x28 0xffffa000019efc80 x29 0xffff000097280560 lr 0xffff000000673a68 kdb_enter+0x40 elr 0xffff000000673a6c kdb_enter+0x44 sp 0xffff000097280560 kdb_enter+0x44: undefined f907c27f db:1:pfs> show pcpu cpuid = 1 dynamic pcpu = 0x3eb20180 curthread = 0xffff00009c22c600: pid 12 tid 100070 critnest 1 "pcib0,0: ath0" curpcb = 0xffff000097280b40 fpcurthread = 0xffff0000e1a86200: pid 29607 "snort" idlethread = 0xffff000040ebb800: tid 100004 "idle: cpu1" curvnet = 0 db:1:pfs> run lockinfo db:2:lockinfo> show locks No such command; use "help" to list available commands db:2:lockinfo> show alllocks No such command; use "help" to list available commands db:2:lockinfo> show lockedvnods Locked vnodes db:1:pfs> acttrace Tracing command clock pid 2 tid 100029 td 0xffff000096fb5c00 (CPU 0) sched_switch() at sched_switch+0x868 mi_switch() at mi_switch+0x100 version() at version+0x12c Tracing command intr pid 12 tid 100070 td 0xffff00009c22c600 (CPU 1) db_trace_self() at db_trace_self _db_stack_trace_all() at _db_stack_trace_all+0xe8 db_command() at db_command+0x358 db_script_exec() at db_script_exec+0x1a4 db_command() at db_command+0x358 db_script_exec() at db_script_exec+0x1a4 db_script_kdbenter() at db_script_kdbenter+0x58 db_trap() at db_trap+0xf4 kdb_trap() at kdb_trap+0x284 handle_el1h_sync() at handle_el1h_sync+0x10 --- exception, esr 0 $d.6() at 0xffff000097000a63 db:1:pfs> ps pid ppid pgrp uid state wmesg wchan cmd 80015 92122 412 0 S nanslp 0xffff00000240378d sleep 77724 44890 26 0 S nanslp 0xffff00000240378c sleep 80274 87627 86665 100 S sbwait 0xffff0000df9e844c perl 54117 87627 86665 100 S sbwait 0xffff0000dfa4e8cc perl 53941 87627 86665 100 S sbwait 0xffff0000df9e6d4c perl 18551 18369 17397 0 S piperd 0xffff0000e14be998 sh 18369 17397 17397 0 S wait 0xffffa0008ee11540 sh 18181 17397 17397 0 S (threaded) sshg-blocker 100326 S piperd 0xffff0000e14bd000 sshg-blocker 100376 S nanslp 0xffff00000240378c sshg-blocker 18028 17397 17397 0 S piperd 0xffff0000e14be110 sshg-parser 17703 17397 17397 0 S piperd 0xffff0000e14666c0 cat 17397 47272 17397 0 Ss wait 0xffffa00099a58000 sh 17327 1 17327 0 Ss+ ttyin 0xffffa00000e604b0 getty 92236 87627 86665 100 S sbwait 0xffff0000dfa5c8cc squidGuard 92108 87627 86665 100 S sbwait 0xffff0000dfa5ed4c squidGuard 91847 87627 86665 100 S sbwait 0xffff0000dfa5db4c squidGuard 91544 87627 86665 100 S sbwait 0xffff0000df9edb4c squidGuard 29607 1 29607 0 Rs (threaded) snort 100336 RunQ snort 100374 S nanslp 0xffff00000240378d snort 100375 S sbwait 0xffff0000dfa6844c snort 57228 87627 86665 100 S select 0xffffa00059604dc0 pinger 56920 87627 86665 100 S sbwait 0xffff0000dfa0cd4c perl 56138 87627 86665 100 S sbwait 0xffff0000df9f4d4c perl 54293 87627 86665 100 S sbwait 0xffff0000dfa168cc perl 51257 87627 86665 100 S sbwait 0xffff0000dfa05b4c perl 50784 87627 86665 100 S sbwait 0xffff0000dfa6bb4c perl 49572 87627 86665 100 S sbwait 0xffff0000df9f56cc squidGuard 48859 87627 86665 100 S sbwait 0xffff0000df9f5fcc squidGuard u47486 87627c86665 n10: USha d dsbLa txt0rfalfdata abfr8c squidGuime psqui=Gu d▒TIM-1.0 WTMI-devel-1.0.0-1115f12 WTMI: system early-init SVC REV: 5, CPU VDD voltage: 1.225V -
@JonathanLee is this snort causing this?
panic: Unhandled EL1 external data abort
It’s the card I can see that but that’s a new card.
-
Hmm, well that is a kernel panic so I would have expected a crash report. Perhaps you don't have SWAP enabled?
Anyway the panic is interesting:
panic: Unhandled EL1 external data abort
cpuid = 1
time = 1714888984
The backtrace is pretty generic:
db:1:pfs> bt
Tracing pid 12 tid 100070 td 0xffff00009c22c600
db_trace_self() at db_trace_self
db_stack_trace() at db_stack_trace+0x11c
db_command() at db_command+0x358
db_script_exec() at db_script_exec+0x1a4
db_command() at db_command+0x358
db_script_exec() at db_script_exec+0x1a4
db_script_kdbenter() at db_script_kdbenter+0x58
db_trap() at db_trap+0xf4
kdb_trap() at kdb_trap+0x284
handle_el1h_sync() at handle_el1h_sync+0x10
--- exception, esr 0
$d.6() at 0xffff000097000a63
Do all the crashes look like that? At least all the same panic string?
-
@stephenw10 Yes it all occurs only when the guest wifi is used and only when the xbox uses disney plus on the internal wifi card. SWAP? It does this and goes to the errors like above over and over and reboots
-
@stephenw10 How can I enable swap? It is a 2100, Jimp said there is a way to do it with the MMC
-
Well I'd first try to capture a few crashes and make sure the panics and bac are all the same. If they are all wildly different it's probably a hardware issue.
You can create a SWAP partition on the eMMC and then add that to the fstab if you need it. I wouldn't do that permanently though, you really don't want the write cycles on eMMC.
-
@stephenw10 I think I found the issues, I have a CAT8 cable that was plugged into a different type of cable by way of a inline port surge protector, so the device assumed it was using that higher bandwidth cable and it would cause issues and crash the port. I just noticed that the fiber company did not use a cable of that quality as they only provide gigabit, so they only use the cable that matches 1000baseT <full-duplex> that and my system had this fancy high quality cable that provided 2500Base-KX <full-duplex> thus it connections to a dual female small inline surge protector, once I remove that and just plugged the new cable it fixed it. Weird right? that was a weird one. It never caused issues with the WAN connection as it would go directly into my power line networking TPAV1200 system before and that was smart and would provide the auto negotiation for the other side, now it can't do that as it is a simple non smart inline surge connection directly into the ONT, so the ONT thinks it had a different speed over the firewall and well that was the problem. It has been up for a half an hour now, but it doesn't explain why it would only occur with the xbox before and my iMac at the same time. Just weird right?
-
Hmm, I'd be surprised if that was the cause. Almost anything should pass 1Gbps. And that WIFI NIC can't get anywhere close to that.
But if it stays up.....
-
@stephenw10 Yeah it doesn't make sense wouldn't it still auto configure and know, maybe my surge device went out from the higher speeds and would just cut out, it uses diodes inside it
-
@stephenw10 But the external AP and the wifi card together can, would would reach that limit at that point
-
@stephenw10 spoke too soon did it again
-
@stephenw10 I went to a new external AP for guest use with a VLAN and it stopped the issue, I don't understand what did it
-
That crash looks to be in the ath driver somewhere. Though it's hard to (for me) to tell for sure. If all the panics and backtraces are identical we can look into it.
