Dashboard Traffic Graph widget showing seconds/minutes not time
-
I have added the Traffic Graph widget to my dashboard. The in/out traffic is working fine but it normally shows the time under the graphs. My pfsense is showing 45:05 and going up. I think this is the a counter from the moment i logged in (not 100% sure).
But a couple friends of mine are also using PfSense and there Traffic Graphs are showing the time.
How do i change this?
I have set the correct timezone and NTP server. I am using 2.5.2.
-
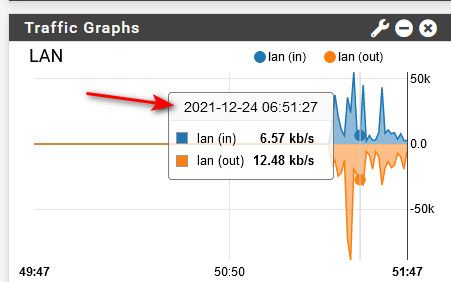
@operations when you highlight a point on the graph does it show you the time?
The bottom of the graph would be the minutes and seconds.. I have no idea what happens if you run the graph continually for a long period.
Could you show us an example of what your seeing, and what these friends are seeing..
Copyright 2025 Rubicon Communications LLC (Netgate). All rights reserved.