• Categories
  • Recent
  • Tags
  • Popular
  • Users
  • Search
  • Register
  • Login
Netgate Discussion Forum
  • Categories
  • Recent
  • Tags
  • Popular
  • Users
  • Search
  • Register
  • Login

Traffic graphs on dashboard showing half bandwidth !

Scheduled Pinned Locked Moved webGUI
13 Posts 4 Posters 1.3k Views
Loading More Posts
  • Oldest to Newest
  • Newest to Oldest
  • Most Votes
Reply
  • Reply as topic
Log in to reply
This topic has been deleted. Only users with topic management privileges can see it.
  • K
    Kartoff
    last edited by Mar 6, 2022, 12:12 PM

    Hello,

    Just realized that graphs on dashboard showing half of the real bandwidth, but graphs in "Status->Traffic Graphs" show whole passing through firewall... I measured it with ookla speedtest and iperf... What can cause this behavior ?

    J 1 Reply Last reply Mar 6, 2022, 1:00 PM Reply Quote 0
    • J
      johnpoz LAYER 8 Global Moderator @Kartoff
      last edited by Mar 6, 2022, 1:00 PM

      @kartoff I am not seeing that.

      show.jpg

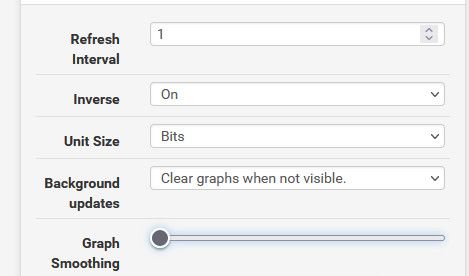
      Make sure you have bit/bytes correctly set, and graph smoothing could effect as well

      click the little wrench icon

      wrench.jpg

      An intelligent man is sometimes forced to be drunk to spend time with his fools
      If you get confused: Listen to the Music Play
      Please don't Chat/PM me for help, unless mod related
      SG-4860 24.11 | Lab VMs 2.8, 24.11

      1 Reply Last reply Reply Quote 0
      • K
        Kartoff
        last edited by Mar 6, 2022, 1:56 PM

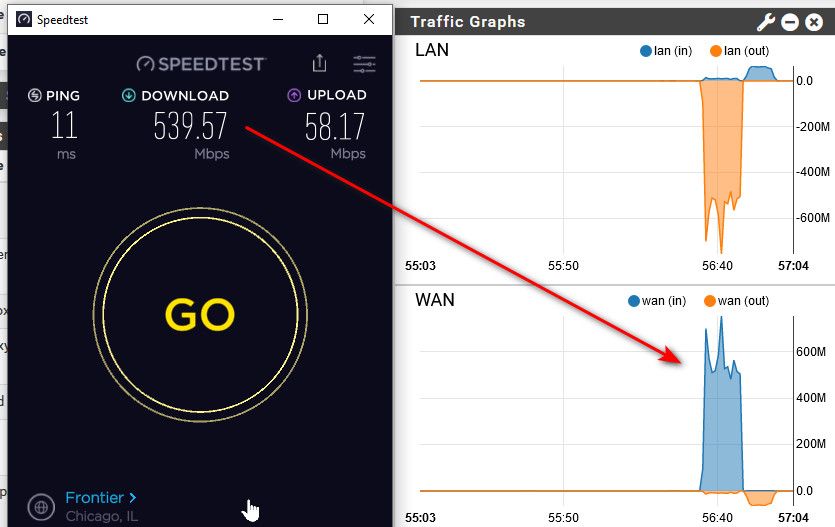
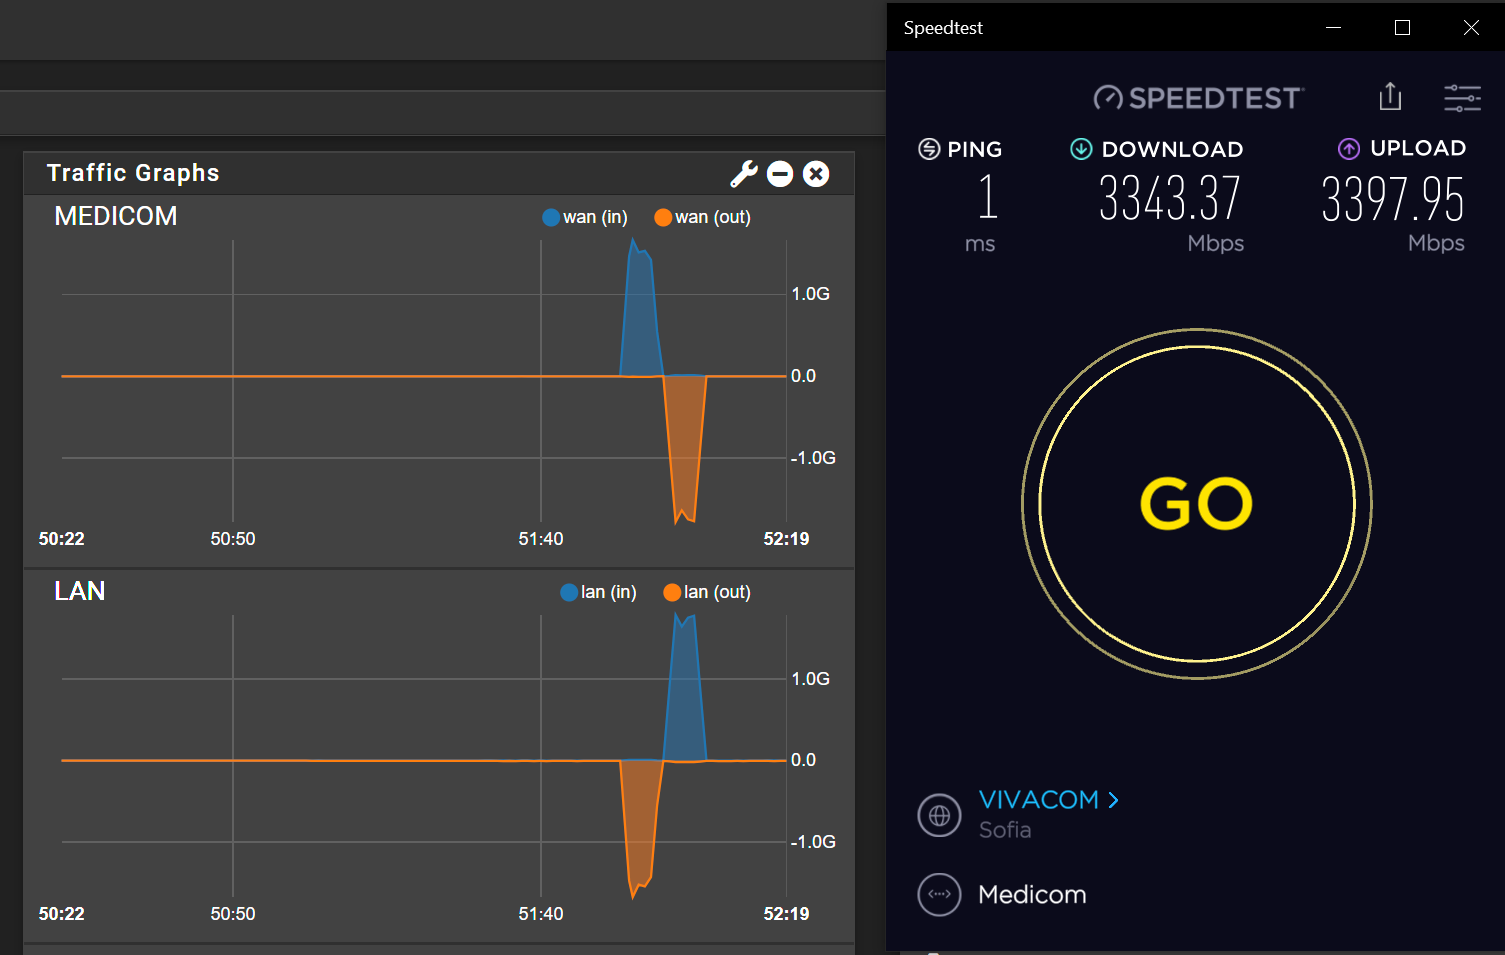
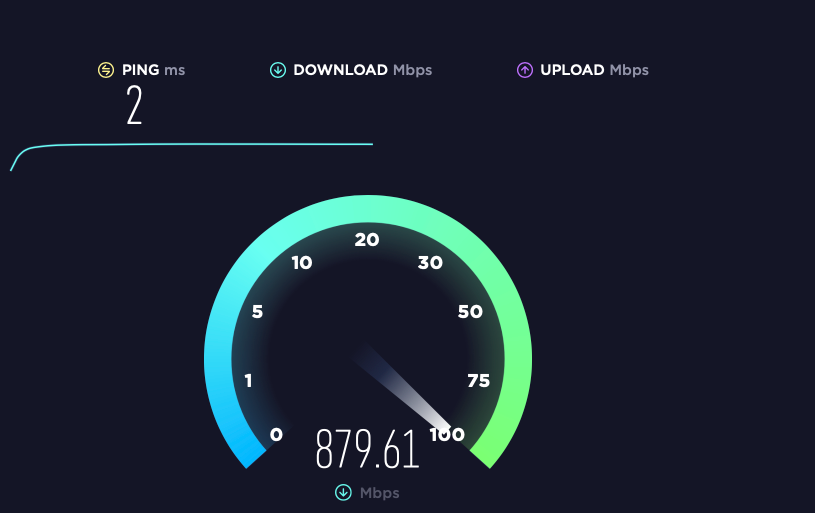
        This is what I am seeing :

        True Band 1.PNG Half Band1.PNG

        J 1 Reply Last reply Mar 6, 2022, 2:03 PM Reply Quote 0
        • J
          johnpoz LAYER 8 Global Moderator @Kartoff
          last edited by Mar 6, 2022, 2:03 PM

          @kartoff what is your smoothing set to?

          An intelligent man is sometimes forced to be drunk to spend time with his fools
          If you get confused: Listen to the Music Play
          Please don't Chat/PM me for help, unless mod related
          SG-4860 24.11 | Lab VMs 2.8, 24.11

          K 1 Reply Last reply Mar 6, 2022, 3:44 PM Reply Quote 0
          • C
            Cool_Corona
            last edited by Mar 6, 2022, 2:59 PM

            I dont see it either...

            251e13ca-6b9b-4aaf-8aea-3c77146e3f80-billede.png

            5b431d42-2cc2-403e-a0eb-30dabd7fecb5-billede.png

            1 Reply Last reply Reply Quote 0
            • K
              Kartoff @johnpoz
              last edited by Kartoff Mar 6, 2022, 3:55 PM Mar 6, 2022, 3:44 PM

              @johnpoz said in Traffic graphs on dashboard showing half bandwidth !:

              @kartoff what is your smoothing set to?

              Same as your shot... That's why I didn't attach mine...

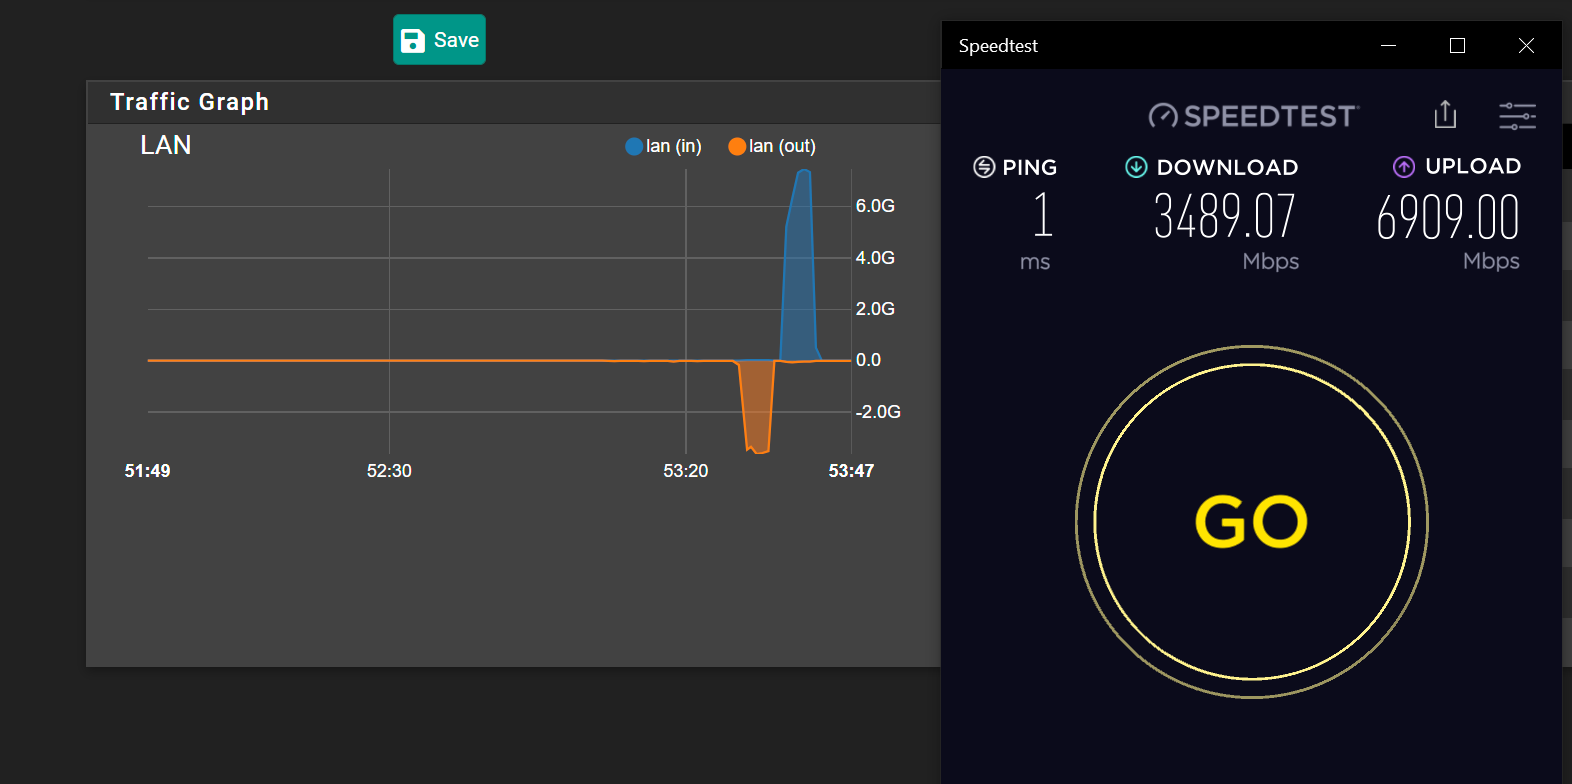
              And this is when I use Load Balancing :
              (Which I finally managed to work - It turnabout that I need to put Group as rule gateway because do not work when set only as default gateway)

              Load Balance Graph.PNG

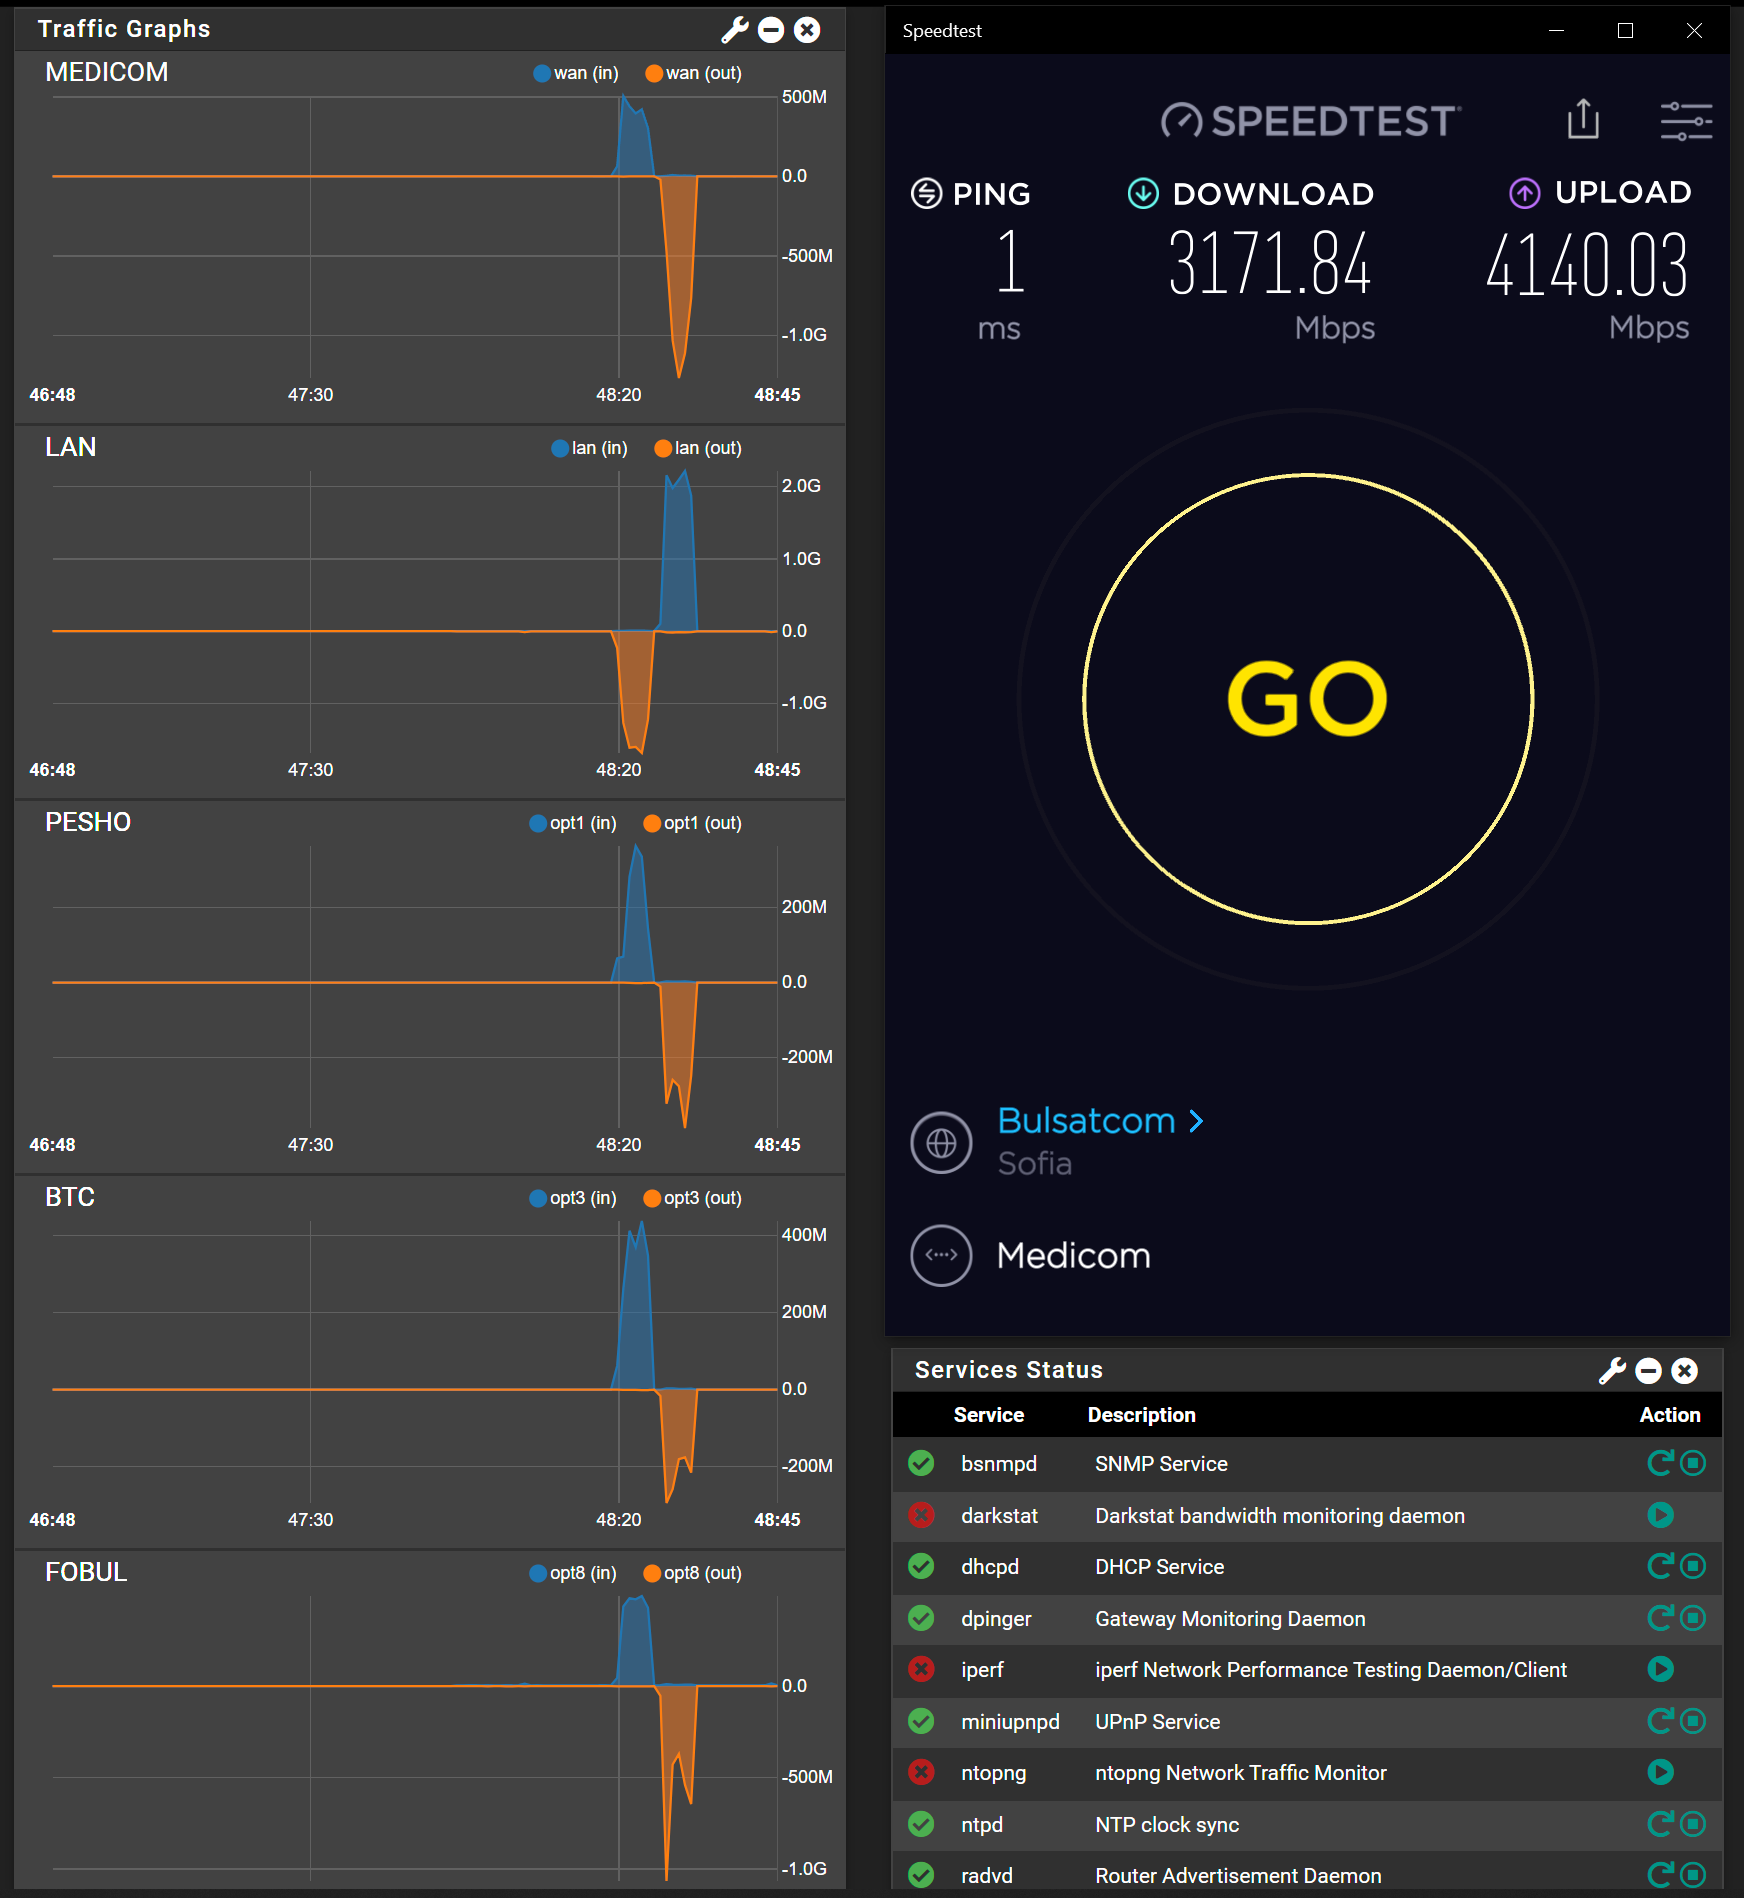
              LAN is LAN, all others are WAN's :)

              J 1 Reply Last reply Mar 6, 2022, 3:53 PM Reply Quote 0
              • J
                johnpoz LAYER 8 Global Moderator @Kartoff
                last edited by Mar 6, 2022, 3:53 PM

                @kartoff @Cool_Corona well all I can say to both of you - is damn.. 1 ms response and those speeds - you both suck ;) hehehheeh

                An intelligent man is sometimes forced to be drunk to spend time with his fools
                If you get confused: Listen to the Music Play
                Please don't Chat/PM me for help, unless mod related
                SG-4860 24.11 | Lab VMs 2.8, 24.11

                K C 2 Replies Last reply Mar 6, 2022, 4:06 PM Reply Quote 1
                • K
                  Kartoff @johnpoz
                  last edited by Mar 6, 2022, 4:06 PM

                  @johnpoz said in Traffic graphs on dashboard showing half bandwidth !:

                  @kartoff @Cool_Corona well all I can say to both of you - is damn.. 1 ms response and those speeds - you both suck ;) hehehheeh

                  That is how it usually supposed to be here :)
                  BTW when response time go up like 2ms and above you definitely have to go to find where is the problem 😵 Like happened with my last WAN where RTT was over 10ms... Solution was to change monitor IP to their DNS server instead of a gateway (set by default) because they set ICMP with lowest priority... Now RTT is 0.2ms :)

                  1 Reply Last reply Reply Quote 0
                  • C
                    Cool_Corona @johnpoz
                    last edited by Mar 6, 2022, 4:29 PM

                    @johnpoz I can actually do a little better...

                    999d45ee-f792-45e3-9275-34822da6445b-billede.png

                    Depending on the peering.

                    J 1 Reply Last reply Mar 6, 2022, 4:38 PM Reply Quote 0
                    • J
                      johnpoz LAYER 8 Global Moderator @Cool_Corona
                      last edited by Mar 6, 2022, 4:38 PM

                      @cool_corona now your just rubbing it in ;) hehehehhe

                      An intelligent man is sometimes forced to be drunk to spend time with his fools
                      If you get confused: Listen to the Music Play
                      Please don't Chat/PM me for help, unless mod related
                      SG-4860 24.11 | Lab VMs 2.8, 24.11

                      1 Reply Last reply Reply Quote 0
                      • K
                        Kartoff
                        last edited by Mar 7, 2022, 11:13 AM

                        Is there a possibility that using VLANs is the cause of that ? I use dual port 40G NIC and everything goes through there...

                        1 Reply Last reply Reply Quote 0
                        • K
                          Kartoff
                          last edited by Apr 27, 2022, 9:46 PM

                          Still nobody with suggestions ? As I remember I did even tried to post about this problem in redmine with hope to be solved in next release but it was removed... How to tweak dashboard graphs to show actual bandwidth instead of half when VLAN's are used ? As I said before without VLAN's real speed is shown.

                          1 Reply Last reply Reply Quote 0
                          • P
                            pwnell
                            last edited by May 9, 2022, 5:54 PM

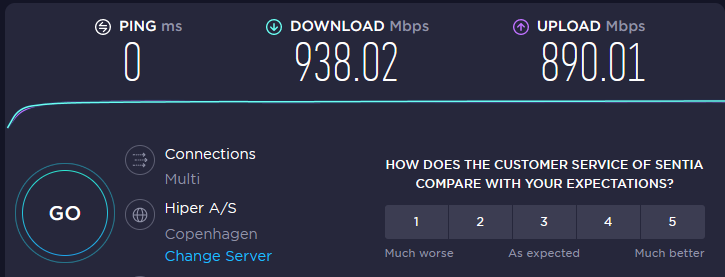
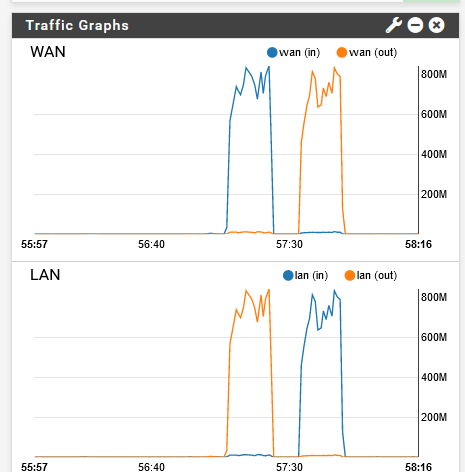
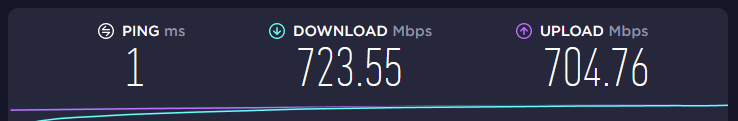
                            Same issue here. WAN is on em1 - no other VLANs on that interface. The dashboard traffic widget:

                            Screen Shot 2022-05-09 at 11.51.21.png

                            Screen Shot 2022-05-09 at 11.51.26.png

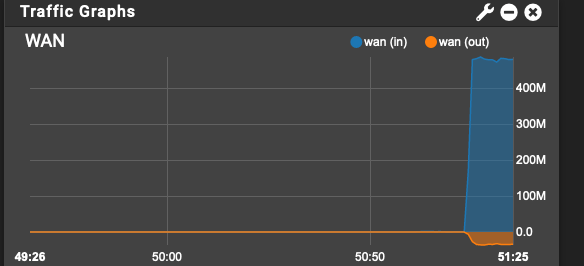
                            Half the actual throughput. Settings same as yours.

                            The Traffic Graph graph shows this (/status_graph.php):

                            Screen Shot 2022-05-09 at 11.51.44.png

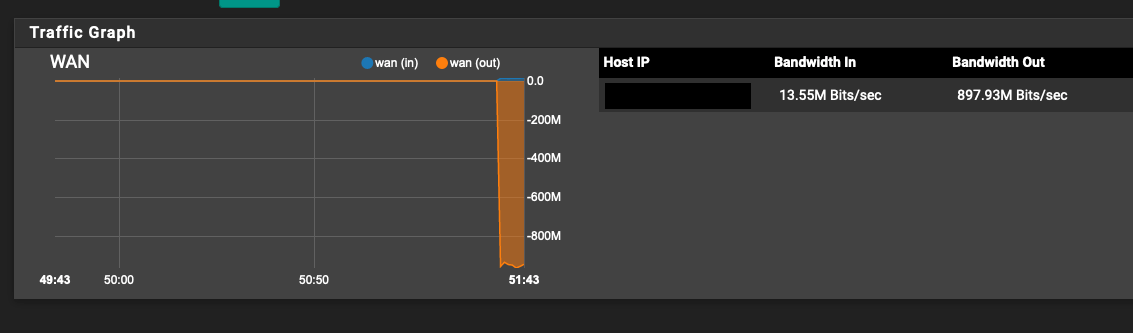
                            which is correct (I have a symmetrical line - upload was 897Mbps during this test)

                            1 Reply Last reply Reply Quote 0
                            • First post
                              Last post
                            Copyright 2025 Rubicon Communications LLC (Netgate). All rights reserved.
                              This community forum collects and processes your personal information.
                              consent.not_received