pfBlockerNG_devel v3.1.0_9 prevents Unbound from starting
-
I just upgraded from _7 to _9 and Unbound will not start up, even after a full reboot. I had to disable pfblockerNG for it to start working again.
-
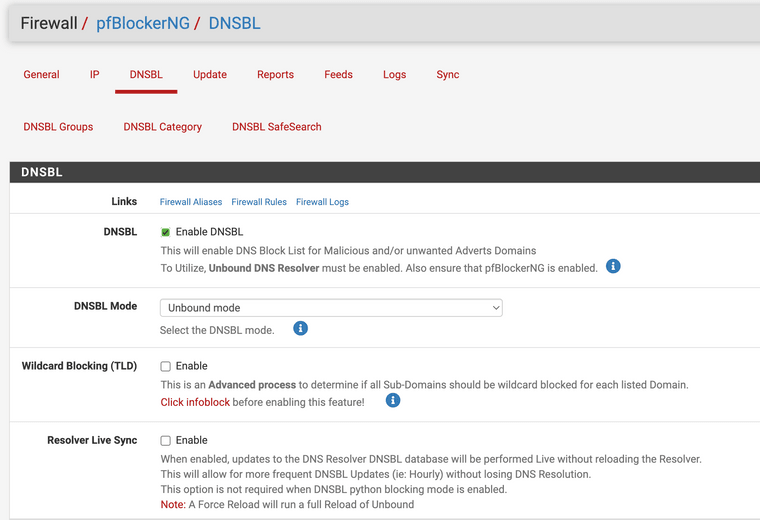
@creationguy Is your setting similar as here below?
-
@nollipfsense
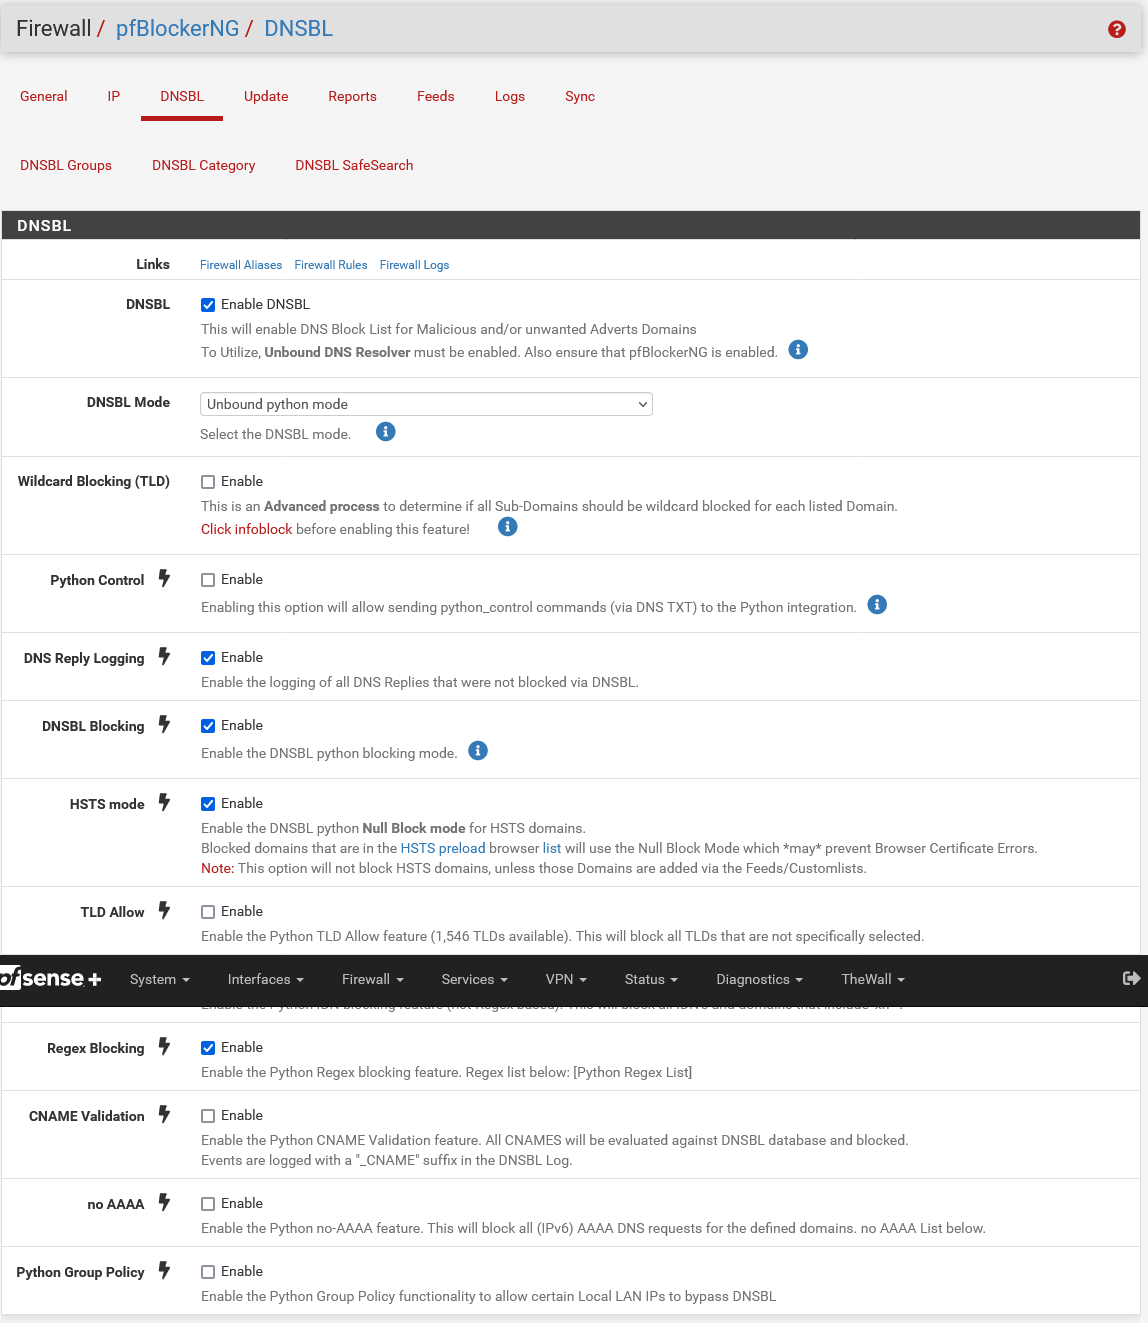
This is what I have:
-
@creationguy So, it appears your config is okay...how about logs, both pfBlockerNG and pfSense system logs for clues as to why Unbound didn't start. I remembered when I update pfSense 2.7 and pfBlockerNG, Unbound didn't start but clicking the start button in service status on the WebGUI and after a few seconds Unbound started, but in my case it's pfBlockerNG 3.1.0_15.
-
@nollipfsense What log are you wanting to see?
Status\System Logs\System\DNS ResolverDec 20 15:10:56 unbound 71315 [71315:0] fatal error: Could not set up local zones Dec 20 15:10:56 unbound 71315 [71315:0] error: local-data in redirect zone must reside at top of zone, not at duckduckgo.www.duckduckgo.com. A 52.149.247.1 Dec 20 15:10:40 unbound 40658 [40658:0] fatal error: Could not set up local zones Dec 20 15:10:40 unbound 40658 [40658:0] error: local-data in redirect zone must reside at top of zone, not at duckduckgo.www.duckduckgo.com. A 52.149.247.1 Dec 20 15:10:40 unbound 13214 [13214:0] info: 2.000000 4.000000 5 Dec 20 15:10:40 unbound 13214 [13214:0] info: 1.000000 2.000000 11 Dec 20 15:10:40 unbound 13214 [13214:0] info: 0.524288 1.000000 18 Dec 20 15:10:40 unbound 13214 [13214:0] info: 0.262144 0.524288 113 Dec 20 15:10:40 unbound 13214 [13214:0] info: 0.131072 0.262144 276 Dec 20 15:10:40 unbound 13214 [13214:0] info: 0.065536 0.131072 229 Dec 20 15:10:40 unbound 13214 [13214:0] info: 0.032768 0.065536 299 Dec 20 15:10:40 unbound 13214 [13214:0] info: 0.016384 0.032768 22 Dec 20 15:10:40 unbound 13214 [13214:0] info: 0.008192 0.016384 10 Dec 20 15:10:40 unbound 13214 [13214:0] info: 0.004096 0.008192 2 Dec 20 15:10:40 unbound 13214 [13214:0] info: 0.002048 0.004096 2 Dec 20 15:10:40 unbound 13214 [13214:0] info: 0.000000 0.000001 11 Dec 20 15:10:40 unbound 13214 [13214:0] info: lower(secs) upper(secs) recursions Dec 20 15:10:40 unbound 13214 [13214:0] info: [25%]=0.0549604 median[50%]=0.109322 [75%]=0.213467 Dec 20 15:10:40 unbound 13214 [13214:0] info: histogram of recursion processing times Dec 20 15:10:40 unbound 13214 [13214:0] info: average recursion processing time 0.166417 sec Dec 20 15:10:40 unbound 13214 [13214:0] info: server stats for thread 1: requestlist max 6 avg 0.51503 exceeded 0 jostled 0 Dec 20 15:10:40 unbound 13214 [13214:0] info: server stats for thread 1: 1427 queries, 429 answers from cache, 998 recursions, 0 prefetch, 0 rejected by ip ratelimiting Dec 20 15:10:40 unbound 13214 [13214:0] info: 4.000000 8.000000 1 Dec 20 15:10:40 unbound 13214 [13214:0] info: 2.000000 4.000000 4 Dec 20 15:10:40 unbound 13214 [13214:0] info: 0.524288 1.000000 28 Dec 20 15:10:40 unbound 13214 [13214:0] info: 0.262144 0.524288 87 Dec 20 15:10:40 unbound 13214 [13214:0] info: 0.131072 0.262144 188 Dec 20 15:10:40 unbound 13214 [13214:0] info: 0.065536 0.131072 126 Dec 20 15:10:40 unbound 13214 [13214:0] info: 0.032768 0.065536 175 Dec 20 15:10:40 unbound 13214 [13214:0] info: 0.016384 0.032768 8 Dec 20 15:10:40 unbound 13214 [13214:0] info: 0.008192 0.016384 5 Dec 20 15:10:40 unbound 13214 [13214:0] info: 0.004096 0.008192 2 Dec 20 15:10:40 unbound 13214 [13214:0] info: 0.000512 0.001024 1 Dec 20 15:10:40 unbound 13214 [13214:0] info: 0.000000 0.000001 4 Dec 20 15:10:40 unbound 13214 [13214:0] info: lower(secs) upper(secs) recursions Dec 20 15:10:40 unbound 13214 [13214:0] info: [25%]=0.0584675 median[50%]=0.127691 [75%]=0.236174 Dec 20 15:10:40 unbound 13214 [13214:0] info: histogram of recursion processing times Dec 20 15:10:40 unbound 13214 [13214:0] info: average recursion processing time 0.192067 sec Dec 20 15:10:40 unbound 13214 [13214:0] info: server stats for thread 0: requestlist max 7 avg 0.394277 exceeded 0 jostled 0 Dec 20 15:10:40 unbound 13214 [13214:0] info: server stats for thread 0: 915 queries, 286 answers from cache, 629 recursions, 0 prefetch, 0 rejected by ip ratelimiting Dec 20 15:10:40 unbound 13214 [13214:0] info: service stopped (unbound 1.15.0). -
@creationguy Looking at the logs, I noticed the duckduckgo line. I had a custom host override to point DDG to their safe search. I removed that and it's working fine now. I have safesearch enabled on pfblockerng.
Looks like everything is working now.
-
@creationguy Glad you got it sorted. Duckduckgo is my default search engine but only on the browser.