High CPU usage on 3.1.0_15
-
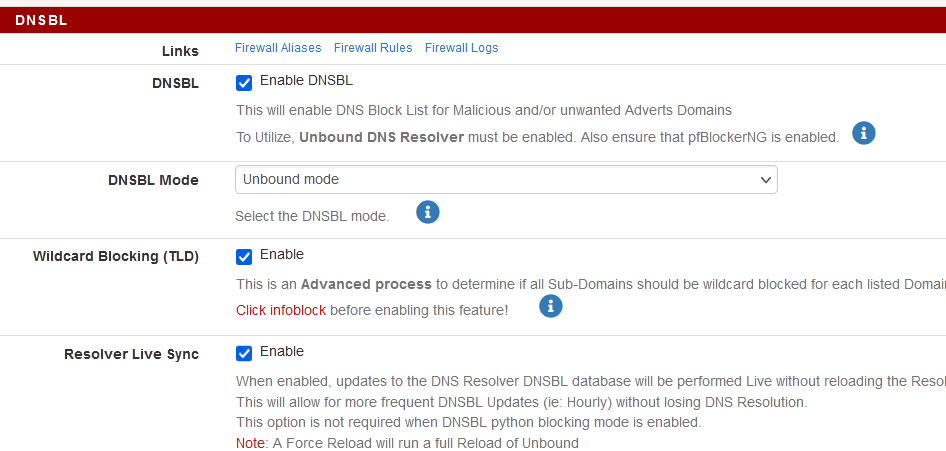
    System


CPU Activity

last pid: 34946;  load averages:  3.43,  3.44,  3.42  up 2+19:50:08    08:35:51
346 threads:   8 running, 319 sleeping, 19 waiting
CPU: 47.2% user,  0.2% nice,  1.9% system,  0.1% interrupt, 50.7% idle
Mem: 3507M Active, 1962M Inact, 1770M Wired, 8492M Free
ARC: 1144M Total, 678M MFU, 404M MRU, 1464K Anon, 9854K Header, 49M Other
     1004M Compressed, 2302M Uncompressed, 2.29:1 Ratio
Swap: 2048M Total, 2048M Free

  PID USERNAME    PRI NICE   SIZE    RES STATE    C   TIME    WCPU COMMAND
22980 root        135    0  1734M  1561M CPU2     2  32.3H 100.00% grep -vF -f /tmp/dnsbl_tld_remove /tmp/pfbtemp3_75438
81103 root        135    0   858M   778M CPU3     3 815:10 100.00% grep -vF -f /tmp/dnsbl_tld_remove.tsp /var/unbound/pfb_dnsbl.tsp
18061 root        135    0  1734M  1561M CPU0     0 503:51 100.00% grep -vF -f /tmp/dnsbl_tld_remove /tmp/pfbtemp3_60318
Top three processes are related to pfBlockerNG-devel. Settings are
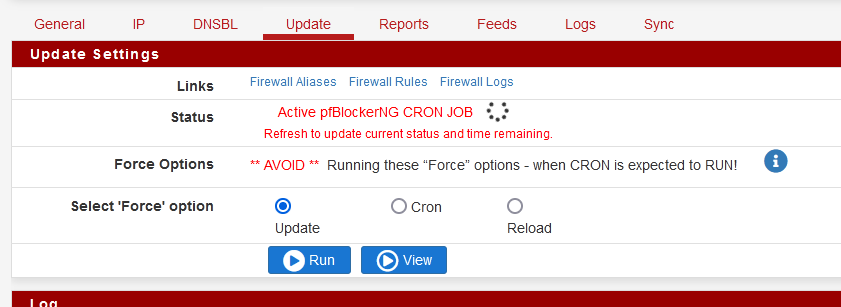
Also, it looks like the CRON JOB is stuck forever
Copyright 2025 Rubicon Communications LLC (Netgate). All rights reserved.