forward alerts.log entries to remote syslog
-
I've been duckduckgoing for days now, can't find an answer...
I want to forward entries from the suricata alert log to a remote syslog, running on debian. Can't find the necessary configuration to achive this.
I'm already forwarding the firewalls filter log, works perfectly (setup using "status / system logs / settings / remote syslog contents"
the suricata "global settings / log to system log" only logs the suricata events, not the alerts, so using that is not an option.
-
Have you checked the box on the INTERFACE SETTINGS page for the Suricata instance that says Send Alerts to System Log?
That will send the timestamp of the alert and some basic information about which rule triggered and what the IP addresses and ports were. But FreeBSD has a hard limit on the payload packet size for syslog data sent to remote systems. If I recall, that limit is 512 bytes. Anything beyond that limit is truncated and not sent over the remote syslog connection. But even with that limit, you should be able to get all the basic alert info. You obviously cannot send packet payload data over that connection, though - a least not all of it.
-
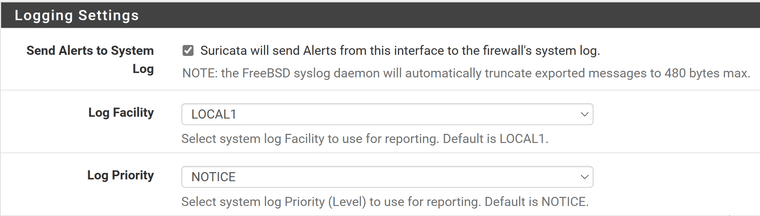
as you can see, I updated the settings, indicated in your reply
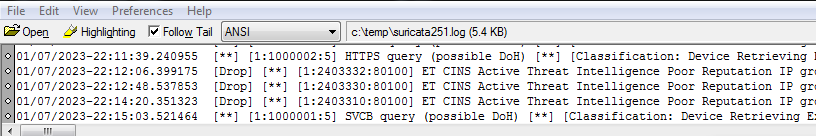
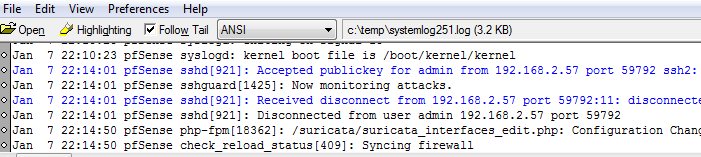
The configuration change is noticed and logged in the system log (third screenshot)I than ran a dig that triggers a suricata alert entry (22:15:03), but nothing appears in the system log.
tried to restart the system logging ( /etc/rc.d/syslogd restart), same result, nothing in the system log.
tried several other combinations (localx - syslog and warning) but no joy.
-
It's been a long time since I visited this, but I went back and looked at the code and then did a little Google research. Suricata has moved most of its logging over to the EVE JSON format. I think you can send the EVE JSON logs over to syslog instead of writing them to EVE log files.
On the INTERFACE SETTINGS tab enable EVE logging, and then in the EVE Output Type drop-down you should see three options: FILE, SYSLOG, and REDIS. Choose SYSLOG and see if that works. You will also likely have to modify some of the syslog templates to tell it to not try and parse the Suricata messages as they will be JSON-encoded.
The better answer is to not use syslog and instead create some flavor of ELK Stack that can directly ingest EVE JSON logs. You can find examples via Google or other search engines.
One weakness of Suricata on pfSense is the difficulty of exporting the logs. I've looked for tools, but everything I've looked at in the past brings in a lot of extra garbage that I don't want to put on someone's firewall. One package even used Java - if you can believe that. Who would want Java on their firewall?
-
@bmeeks I’ve been toying with pfelk. There is a docker container for easy installation. I’ve created a central dashboard for my pfsense deployments. Still playing with it tho.
-
@michmoor:
I tested this in response to your post in another thread. It worked fine by simply enabling the option to send alerts to the system log on the INTERFACE SETTINGS tab. Here is the post where I showed it working with screenshots: https://forum.netgate.com/topic/176984/how-to-forward-new-entries-from-a-specific-log-to-a-remote-syslog-server/6?_=1673203643253.Be sure that you restart Suricata on the interface anytime you make changes to its configuration on the INTERFACE SETTINGS tab. The Suricata daemon is not dynamic. It only reads its configuration once during initial startup. When the logging configuration is changed, Suricata must be restarted on the interface in order to pick up the changes.
-
@jpgpi250 said in forward alerts.log entries to remote syslog:
I've been duckduckgoing for days now, can't find an answer...
I want to forward entries from the suricata alert log to a remote syslog, running on debian. Can't find the necessary configuration to achive this.
I'm already forwarding the firewalls filter log, works perfectly (setup using "status / system logs / settings / remote syslog contents"
the suricata "global settings / log to system log" only logs the suricata events, not the alerts, so using that is not an option.
I think the most elegant way would be to install the “Syslog-ng” package, and have that monitor that file and syslog forward new entries to your SYSLOG host. It works like a charm.
I use the Syslog-ng package on remote sites as a concentrator for switches and AP’s there. They all syslog til syslog-ng, which in turn forwards it to my central syslog host via Syslog over TCP (No lost messages). At the same time Syslog-ng monitors all relevant logfiles on pfSense itself to forward new entries in those - fx. PfBlockerNG DNSBL logs, and FreeRadius logs apart from the standard pfSense Logs. pfSense itself is not setup to syslog forwarding to Syslog-ng. It just writes to local files as pr. Standard. Those files are instead monitored by Syslog-ng locally.
A neat feature with this setup is that Syslog-NG can also forward directly to ElasticSeach, Greylog and other log utilities that has has their own extended dataformat (not using syslog only format).
This included JSON formats and what not. Quite a nice package in my opinion -
I have been thinking about this, unfortunately, if I read things correctly, using syslog-ng to achieve this, requires installation on both (pfsense and destination (=debian) devices. Installing syslog-ng on debian removes rsyslog, don't want that, entire alerting is build around rsyslog.
@bmeeks
spent the entire day trying to get this working with EVE, finally got it to work:
changes on the interface:-
Send Alerts to System Log: checked
-
Log Facility: LOCAL1
-
Log Priority: WARNING
-
EVE JSON Log: checked
-
EVE Output Type: SYSLOG
-
EVE Syslog Output Facility: SYSLOG
-
EVE Syslog Output Priority: WARNING
-
EVE Log Alerts: checked
-
EVE Log Alert Payload Data Formats: NO
unchecked everything else in the EVE section
changes in status / system logs / settings:
- Enable Remote Logging: checked
- Source Address: any
- IP Protocol: IPv4
- Remote log servers: 192.168.2.57:514
- Remote Syslog Contents: checked 'system events' and 'firewall events'
on the receiving end (rsyslog on debian):
file /etc/rsyslog.d/pfsense.conf, content:module(load="imudp") input(type="imudp" port="514") if ( $fromhost-ip == '192.168.2.59' ) then { if ($msg contains '1583865018' or $msg contains '1583865117' or $msg contains '1670851002') then { /home/pi/rsyslog/rsyslog_pfsensefilter.log stop } else if ($msg contains 'SVCB' or $msg contains 'HTTPS') then { /home/pi/rsyslog/rsyslog_suricata.log stop } else { stop } }this ensures the message doesn't appear in the local syslog, but is stored in specific files (for later processing - automated) the IP is the pfsense IP to which the debian server is connected. The numeric msg values are the firewall rules id's. The SVCB and HTTPS messages are part of the rules I'm testing to detect possible DoH attempts (also discussed here):
alert dns any any -> $EXTERNAL_NET 53 (msg:"SVCB query (possible DoH)"; content:"|00 01 00 00 00 00 00|"; content:"|00 00 40 00 01|"; fast_pattern; distance:3; classtype:external-ip-check; sid:1000001; rev:5; metadata:affected_product Any, attack_target Client_Endpoint, created_at 2023_01_01, deployment Perimeter, former_category DNS, signature_severity Minor, updated_at 2023_01_01;)
alert dns any any -> $EXTERNAL_NET 53 (msg:"HTTPS query (possible DoH)"; content:"|00 01 00 00 00 00 00|"; content:"|00 00 41 00 01|"; fast_pattern; distance:3; classtype:external-ip-check; sid:1000002; rev:5; metadata:affected_product Any, attack_target Client_Endpoint, created_at 2023_01_01, deployment Perimeter, former_category DNS, signature_severity Minor, updated_at 2023_01_01;)
Thanks to everybody for the suggestions, help, time and effort.
-
-
 J jpgpi250 referenced this topic on
-
 B bmeeks referenced this topic on
-
B bmeeks referenced this topic on
-
@jpgpi250 said in forward alerts.log entries to remote syslog:
I have been thinking about this, unfortunately, if I read things correctly, using syslog-ng to achieve this, requires installation on both (pfsense and destination (=debian) devices. Installing syslog-ng on debian removes rsyslog, don't want that, entire alerting is build around rsyslog.
No it does not. Syslog-NG can forward standard syslog messages from a log file (in syslog format) to any flavour of syslog daemons you like. I use LOKI (so i can visualize with Grafana), but I considered RSYSLOG a lot.
The simplest solution would be to install the SYSLOG-NG package, and under advanced create 3 objects:
Source: Your Suricata logfile
Destination: Your SYSLOG host (Debian with rsyslog running)
Log: source -> destinationIt would litterally take less than 5 minutes to make the entire setup.
-
@keyser this is how I got mine working. Forwarded logs to Elk.