Suricata issue in PFSense
-
If not using Inline IPS Mode, then the only other thing I can imagine is that on the INTERFACE SETTINGS tab for the interface the option for "Promiscuous Mode" is checked. The default setting is "checked". You can clear that checkbox if desired.
-
@bmeeks so do you thnk I should turn it off on all VLANS also?
-
@sstatjm said in Suricata issue in PFSense:
@bmeeks so do you thnk I should turn it off on all VLANS also?
It depends on what you want to accomplish with your monitoring.
If you are running essentially the same rules on each VLAN interface, then it will be much more efficient to turn on promiscuous mode and only run a single Suricata instance (preferably on the parent interface). That will use less RAM and CPU resources, because each interface you configure for Suricata launches its own unique running instance of the Suricata binary. So, more VLANs with Suricata running on each VLAN means more individual Suricata instances with each one consuming RAM and CPU cycles.
If each VLAN interface runs vastly different rules, then turning off promiscuous mode on each interface (VLANs and parent) and running multiple Suricata instances would be required. But in many cases you can be perfectly fine with a single instance monitoring all of the VLANs on a parent interface using a set of rules that covers the vulnerabilities in all of the monitored networks. In this type of setup, you would enable promiscuous mode.
-
@bmeeks I have the resources on my pfsense setup. Gonna give that a shot and turn off on each and see what happens.
-
No dice on the promiscuous mode. Would it be better to run things in inline mode? Well at least the LAN maybe or just the VLANS only?
-
@sstatjm said in Suricata issue in PFSense:
No dice on the promiscuous mode. Would it be better to run things in inline mode? Well at least the LAN maybe or just the VLANS only?
Did you restart Suricata on each interface after making the change in the promiscuous mode setting? Suricata is not dynamic. It only reads its configuration parameters once during startup. It does not respond to changes in the
suricata.yamlconfiguration on-the-fly.Inline IPS Mode will not help you here as it will automatically run on the parent interface as I said earlier, and thus will see all traffic from all the VLANs on that parent. In general, Inline IPS Mode and VLANs is not a good practice due to how the underlying netmap kernel device interacts with the virtual interfaces created for VLANs by the operating system.
-
@bmeeks oh ok. I never stop and restart it. Only did a restart only. I just did it thou. So will monitor for a few hours and see
-
@sstatjm said in Suricata issue in PFSense:
@bmeeks oh ok. I never stop and restart it. Only did a restart only. I just did it thou. So will monitor for a few hours and see
A restart using the GUI icon is sufficient. That actually issues successive "stop" and then "start" commands to the binary running on the interface.
Do your VLANs communicate with each other? If so, it would be expected to see addresses from other VLANs show up in alerts for a given VLAN. So for example, if a host in VLAN A communicates with a host in VLAN B, and that traffic triggers an alert, you would expect to see the VLAN A host address in the alerts for VLAN B and the VLAN B address in the alerts for VLAN A. Are you seeing that type of traffic, or something else?
-
@bmeeks There is nothing hosting on Lan and VLan1, however they both talk to Vlan2. So why would ip addresses for Vlan1 show up in LAN?
-
@sstatjm said in Suricata issue in PFSense:
@bmeeks There is nothing hosting on Lan and VLan1, however they both talk to Vlan2. So why would ip addresses for Vlan1 show up in LAN?
I'm not following your description. Give me the name of the physical parent interface for each VLAN you have, or even better, screenshot the Interface Assignments and VLANs tabs from your pfSense installation.
The phrase "there is nothing hosting on Lan and VLan1" is confusing to me. What do you mean by that?
-
LAN and TREJAH isnt suppose to talk to each other
-
@sstatjm said in Suricata issue in PFSense:
LAN and TREJAH isnt suppose to talk to each other
This is not what I mean. I need to see the actual Assignments tab content along with the VLANs tab content. I am trying to figure out which physical interface or interfaces is hosting which VLANs.
-
@bmeeks WAN & LAN is the physical interface and the others are the VLANs.
-
@sstatjm said in Suricata issue in PFSense:
@bmeeks WAN & LAN is the physical interface and the others are the VLANs.
You are not understanding my request.
Your VLANs run on a physical interface. In FreeBSD, that will be based on the hardware NIC driver. For example, a popular Intel model is
igb. When you create VLANs, they are created as virtual interfaces on top of some parent interface. The VLAN interfaces will show up asigb0.10or something where the.10is the VLAN ID andigb0is the physical parent interface. If you have 4 NIC ports on a box and all four use theigbdriver, then your four physical interfaces on the firewall will beigb0,igb1,igb2, andigb3. If you created VLANs on any of those physical interfaces, the VLAN's physical parent would be 'igbXfollowed by a period (.) and the assigned VLAN ID.So I need to know which physical interface is your LAN and what the physical interfaces are for your VLANs.
-
-
@sstatjm said in Suricata issue in PFSense:
Okay, that shows everything is running on the same underlying single physical interface -
ix1. Your two VLANs are running on virtual interfacesix1.50andix1.60.The first thing to check is that the Promiscuous Mode checkbox on the INTERFACE SETTINGS tab is NOT checked on all three interfaces: LAN, iOT, and Trejah. If you make any change to any of these interface settings, restart Suricata on the affected interface.
Promiscuous Mode would be the most likely cause of seeing an IP address on an interface where you do not normally expect it. It's also possible that you have a port misconfiguration in your managed switch. A third possibility is something changed with regards to promiscuous mode upstream in the Suricata binary, but I am not aware of any issues being reported there. Nothing has changed around that code in the PHP GUI in eons (that I can recall).
If this is a sudden change in behavior, then I would first suspect an issue in the Layer 2 infrastructure. Maybe a port was mistakenly misconfigured on the switch, or somebody plugged something into the wrong switch port ???
-
@bmeeks Suricata is restarted. Promiscuous mode is unchecked. Nothing connected incorrectly to switch.
-
@sstatjm said in Suricata issue in PFSense:
@bmeeks Suricata is restarted. Promiscuous mode is unchecked. Nothing connected incorrectly to switch.
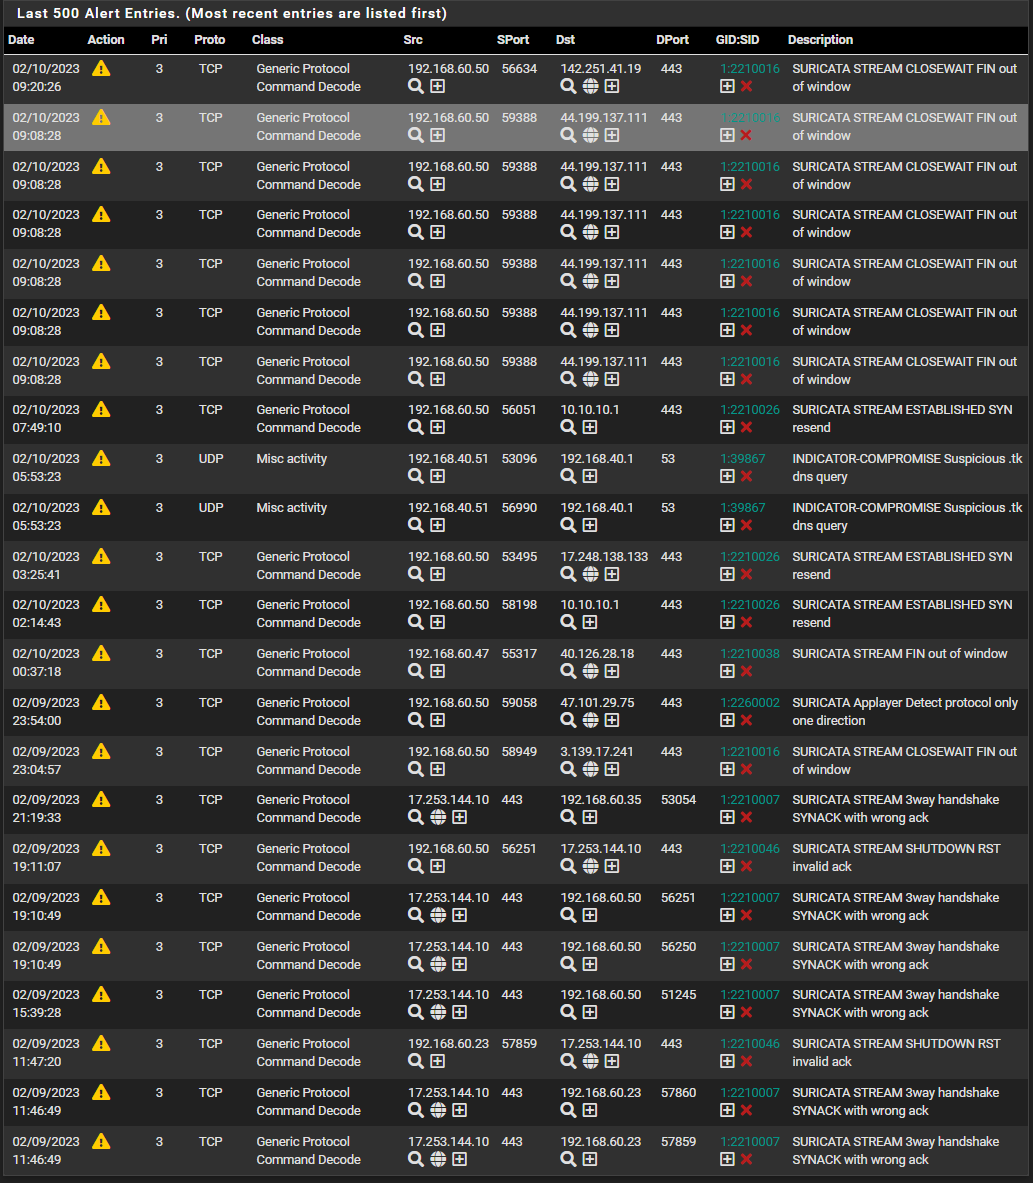
If you want to share the alerts in question, me having a look at them might be helpful. I would also need to know the IP subnets you have assigned to each interface: LAN, iOT, and Trejah. I assume those are RFC1918 space, so there would be no security concerns with sharing the IP subnets as those are non-routable on the Internet anyway.
-
All this is on LAN interface with the .60.50 which is VLAN 60 sources showing in there.
-
Curious, so no
192.168.50.xentries show up on the LAN, or did you just not include them as they may be expected?The most straightforward explanation is that promiscuous mode is enabled even if not explicitly showing as such in the GUI.
From one of your earlier replies I got the impression this behavior just suddenly started happening, and prior to that you never saw
192.168.60.50addresses in alerts on the LAN. Is that correct?Has anything changed in your environment that might coincide with this change in behavior? Promiscuous Mode can't just turn on by itself with no user action. Have you updated any software or firmware either on pfSense or in the managed switch infrastructure? Might a port VLAN setting have been accidentally altered?
If you can, try rebooting the firewall to be sure there are no duplicate Suricata processes running that may still have promiscuous mode enabled. In rare cases multiple Suricata instances can get started on the same interface, and then all but the most recently launched one stop responding to configuration changes. Running this command can show if any duplicates are running:
ps -ax | grep suricataYou should see one Suricata instance per interface, so four instances for you counting your WAN.