Suricata process dying due to hyperscan problem
-
Symptom: WAN Suricata instance works just fine, but the PC (one of several LAN side interfaces) interface instance dumps core immediately after starting with Signal 11.
Nov 25 14:43:06 	kernel 		pid 36387 (suricata), jid 0, uid 0: exited on signal 11 (core dumped)
Nov 25 14:43:06 	php 	94371 	[Suricata] Suricata START for PC(vtnet0.700)...
Nov 25 14:43:05 	php 	94371 	[Suricata] Building new sid-msg.map file for PC...
Nov 25 14:43:05 	php 	94371 	[Suricata] Enabling any flowbit-required rules for: PC...
Nov 25 14:43:05 	php 	94371 	[Suricata] Updating rules configuration for: PC ...
Nov 25 14:43:05 	php 	94371 	[Suricata] Building new sid-msg.map file for WAN...
Nov 25 14:43:05 	php 	94371 	[Suricata] Enabling any flowbit-required rules for: WAN...
Nov 25 14:43:04 	php 	94371 	[Suricata] Updating rules configuration for: WAN ...
Nov 25 14:43:04 	php-fpm 	64493 	Starting Suricata on PC(vtnet0.700) per user request...
The Suricata log for the PC interface does not contain any reference to hyperscan.
I tried the ASLR changes that you suggested. The first one didn't appear to work.
elfctl  -e +noaslr /usr/local/lib/libhs.so.5.4.0
elfctl: NT_FREEBSD_FEATURE_CTL note not found
elfctl: NT_FREEBSD_FEATURE_CTL note not found
The second one, for the Suricata binary did work. Now when I start Suricata both instances start and so far they appear to stay running. However, if I shutdown Suricata I see the Signal 10 and core dump.
Nov 25 15:26:11 kernel pid 22945 (suricata), jid 0, uid 0: exited on signal 10 (core dumped) Nov 25 15:26:10 kernel vtnet0.700: promiscuous mode disabled Nov 25 15:26:10 kernel vtnet0: promiscuous mode disabled Nov 25 15:26:09 SuricataStartup 93534 Suricata STOP for PC(23822_vtnet0.700)... Nov 25 15:26:08 kernel vtnet1: promiscuous mode disabled Nov 25 15:26:06 SuricataStartup 79721 Suricata STOP for WAN(65037_vtnet1)... -
It appears I spoke too soon. Now my WAN interface instance of Suricata is dumping core and the PC one is staying up. The WAN interface suricata.log file does include the Hyperscan log entry that you're chasing. As you can see from the logs, the instance ran for about 18 minutes before dumping core and reporting the Hyperscan error.
[214708 - RX#01-vtnet1] 2023-11-25 15:27:25 Info: checksum: No packets with invalid checksum, assuming checksum offloading is NOT used [214710 - W#02] 2023-11-25 15:45:18 Error: spm-hs: Hyperscan returned fatal error -1.``` -
@masons said in Suricata process dying due to hyperscan problem:
elfctl -e +noaslr /usr/local/lib/libhs.so.5.4.0
elfctl: NT_FREEBSD_FEATURE_CTL note not found
elfctl: NT_FREEBSD_FEATURE_CTL note not foundOops, looks like the library does not offer that option. I'll update my previous post to remove attempting to disable ASLR in the library. But it does work for Suricata (at least disabling ASLR, that is).
-
Hello,
I'm having the same problem.
I have 6 interfaces set up with Suricata. and only 2 of them are stopped randomly.
One using IX0 on WAN
And the other one using VLAN on IX1
device = '82599ES 10-Gigabit SFI/SFP+ Network Connection'
Using IPS Mode - Legacy ModeI deleted one of the monitored interfaces in Suricata that was having the issue, duplicated a working one. And got the same error on the new (same as before) interface. Also tried to disable some of the working ones but nothing changed.
Suricata log
[607907 - W#02] 2023-11-27 08:35:42 Error: spm-hs: Hyperscan returned fatal error -1.System log.
Nov 27 08:35:42 kernel ix0: promiscuous mode disabled -
@jowe78 Have Suricata in IPS mode on the WAN interface. Had a crash once a day with hyperscan mode. Yesterday I switched to AK-CS mode and it crashed in half a day running. There is no error in logs.
Now I'm switching to AC-BS mode and keep you updated. -
@bmeeks
i'll try asapHyperscan License Change after 5.4
According to Accelerate Snort Performance with Hyperscan and Intel Xeon Processors on Public Clouds versions of Hyperscan later than 5.4 are going to be closed-source:https://github.com/VectorCamp/vectorscan
how about vectorscan? there is plan for it?
.....
106211 - Suricata-Main] 2023-11-27 13:12:52 Notice: threads: Threads created -> W: 1 FM: 1 FR: 1 Engine started.
[863533 - W#01-vmx2] 2023-11-27 13:12:53 Info: checksum: No packets with invalid checksum, assuming checksum offloading is NOT used
[863533 - W#01-vmx2] 2023-11-27 13:13:00 Error: spm-hs: Hyperscan returned fatal error -1.elfctl did not help for me
i don't have /root/suricata.core after the crash from hyperscan
gdb (b exit) :
27/11/2023 -- 16:09:46 - <Notice> -- Threads created -> W: 1 FM: 1 FR: 1   Engine started.
27/11/2023 -- 16:09:47 - <Info> -- No packets with invalid checksum, assuming checksum offloading is NOT used
27/11/2023 -- 16:10:12 - <Error> -- Hyperscan returned fatal error -1.
[Switching to LWP 925298 of process 75227]

Thread 3 "W#01-vmx2" hit Breakpoint 5, 0x00000008016be454 in exit () from /lib/libc.so.7
(gdb) bt
#0  0x00000008016be454 in exit () from /lib/libc.so.7
#1  0x00000000006de629 in ?? ()
#2  0x000000000061d9ac in ?? ()
#3  0x000000000061ac4e in AppLayerProtoDetectGetProto ()
#4  0x00000000006197c9 in ?? ()
#5  0x0000000000619439 in AppLayerHandleTCPData ()
#6  0x00000000005aee4a in StreamTcpReassembleAppLayer ()
#7  0x00000000005af9e2 in StreamTcpReassembleHandleSegment ()
#8  0x00000000005b2b9f in ?? ()
#9  0x00000000005b15e2 in StreamTcpPacket ()
#10 0x00000000005b7817 in StreamTcp ()
#11 0x00000000006731c1 in ?? ()
#12 0x0000000000672a1a in ?? ()
#13 0x00000000006a5256 in TmThreadsSlotVarRun ()
#14 0x000000000067409e in ?? ()
#15 0x0000000801468ff4 in ?? () from /usr/local/lib/libpcap.so.1
#16 0x00000000006737b7 in ?? ()
#17 0x00000000006a83aa in ?? ()
#18 0x0000000800f02d25 in ?? () from /lib/libthr.so.3
#19 0x0000000000000000 in ?? ()
Backtrace stopped: Cannot access memory at address 0x7fffdfdfd000
(gdb) bt full
#0  0x00000008016be454 in exit () from /lib/libc.so.7
No symbol table info available.
#1  0x00000000006de629 in ?? ()
No symbol table info available.
#2  0x000000000061d9ac in ?? ()
No symbol table info available.
#3  0x000000000061ac4e in AppLayerProtoDetectGetProto ()
No symbol table info available.
#4  0x00000000006197c9 in ?? ()
No symbol table info available.
#5  0x0000000000619439 in AppLayerHandleTCPData ()
No symbol table info available.
#6  0x00000000005aee4a in StreamTcpReassembleAppLayer ()
No symbol table info available.
#7  0x00000000005af9e2 in StreamTcpReassembleHandleSegment ()
No symbol table info available.
#8  0x00000000005b2b9f in ?? ()
No symbol table info available.
#9  0x00000000005b15e2 in StreamTcpPacket ()
No symbol table info available.
#10 0x00000000005b7817 in StreamTcp ()
No symbol table info available.
#11 0x00000000006731c1 in ?? ()
No symbol table info available.
#12 0x0000000000672a1a in ?? ()
No symbol table info available.
#13 0x00000000006a5256 in TmThreadsSlotVarRun ()
No symbol table info available.
#14 0x000000000067409e in ?? ()
No symbol table info available.
#15 0x0000000801468ff4 in ?? () from /usr/local/lib/libpcap.so.1
No symbol table info available.
#16 0x00000000006737b7 in ?? ()
No symbol table info available.
#17 0x00000000006a83aa in ?? ()
No symbol table info available.
#18 0x0000000800f02d25 in ?? () from /lib/libthr.so.3
No symbol table info available.
#19 0x0000000000000000 in ?? ()
No symbol table info available.
Backtrace stopped: Cannot access memory at address 0x7fffdfdfd000
(gdb) info threads
  Id   Target Id                                   Frame
  1    LWP 100968 of process 75227 "Suricata-Main" 0x000000080169a6ea in _nanosleep () from /lib/libc.so.7
  2    LWP 924434 of process 75227 "IM#01"         0x000000080169a7ea in _read () from /lib/libc.so.7
* 3    LWP 925298 of process 75227 "W#01-vmx2"     0x00000008016be454 in exit () from /lib/libc.so.7
  4    LWP 925299 of process 75227 "FM#01"         0x0000000800efffdc in ?? () from /lib/libthr.so.3
  5    LWP 925300 of process 75227 "FR#01"         0x0000000800efffdc in ?? () from /lib/libthr.so.3
(gdb) thread apply all bt

Thread 5 (LWP 925300 of process 75227 "FR#01"):
#0  0x0000000800efffdc in ?? () from /lib/libthr.so.3
#1  0x0000000800f10022 in ?? () from /lib/libthr.so.3
#2  0x0000000800f01b9d in ?? () from /lib/libthr.so.3
#3  0x00000000005ecb12 in ?? ()
#4  0x00000000006a87a8 in ?? ()
#5  0x0000000800f02d25 in ?? () from /lib/libthr.so.3
#6  0x0000000000000000 in ?? ()
Backtrace stopped: Cannot access memory at address 0x7fffdf9fb000

Thread 4 (LWP 925299 of process 75227 "FM#01"):
#0  0x0000000800efffdc in ?? () from /lib/libthr.so.3
#1  0x0000000800f10022 in ?? () from /lib/libthr.so.3
#2  0x0000000800f01b9d in ?? () from /lib/libthr.so.3
#3  0x00000000005ec633 in ?? ()
#4  0x00000000006a87a8 in ?? ()
#5  0x0000000800f02d25 in ?? () from /lib/libthr.so.3
#6  0x0000000000000000 in ?? ()
Backtrace stopped: Cannot access memory at address 0x7fffdfbfc000

Thread 3 (LWP 925298 of process 75227 "W#01-vmx2"):
#0  0x00000008016be454 in exit () from /lib/libc.so.7
#1  0x00000000006de629 in ?? ()
#2  0x000000000061d9ac in ?? ()
#3  0x000000000061ac4e in AppLayerProtoDetectGetProto ()
#4  0x00000000006197c9 in ?? ()
#5  0x0000000000619439 in AppLayerHandleTCPData ()
#6  0x00000000005aee4a in StreamTcpReassembleAppLayer ()
#7  0x00000000005af9e2 in StreamTcpReassembleHandleSegment ()
#8  0x00000000005b2b9f in ?? ()
#9  0x00000000005b15e2 in StreamTcpPacket ()
#10 0x00000000005b7817 in StreamTcp ()
#11 0x00000000006731c1 in ?? ()
#12 0x0000000000672a1a in ?? ()
#13 0x00000000006a5256 in TmThreadsSlotVarRun ()
#14 0x000000000067409e in ?? ()
#15 0x0000000801468ff4 in ?? () from /usr/local/lib/libpcap.so.1
#16 0x00000000006737b7 in ?? ()
#17 0x00000000006a83aa in ?? ()
#18 0x0000000800f02d25 in ?? () from /lib/libthr.so.3
#19 0x0000000000000000 in ?? ()
Backtrace stopped: Cannot access memory at address 0x7fffdfdfd000

Thread 2 (LWP 924434 of process 75227 "IM#01"):
#0  0x000000080169a7ea in _read () from /lib/libc.so.7
#1  0x0000000800f0ea13 in ?? () from /lib/libthr.so.3
#2  0x00000000006355ed in AlertPfMonitorIfaceChanges ()
--Type <RET> for more, q to quit, c to continue without paging--
#3  0x0000000800f02d25 in ?? () from /lib/libthr.so.3
#4  0x0000000000000000 in ?? ()
Backtrace stopped: Cannot access memory at address 0x7fffdfffe000

Thread 1 (LWP 100968 of process 75227 "Suricata-Main"):
#0  0x000000080169a6ea in _nanosleep () from /lib/libc.so.7
#1  0x0000000800f0e82c in ?? () from /lib/libthr.so.3
#2  0x000000080161ec46 in usleep () from /lib/libc.so.7
#3  0x000000000059fa6a in ?? ()
#4  0x000000000059f3b4 in SuricataMain ()
#5  0x00000008015f06fa in __libc_start1 () from /lib/libc.so.7
#6  0x000000000059bea0 in _start ()
(gdb) thread apply all bt full

Thread 5 (LWP 925300 of process 75227 "FR#01"):
#0  0x0000000800efffdc in ?? () from /lib/libthr.so.3
No symbol table info available.
#1  0x0000000800f10022 in ?? () from /lib/libthr.so.3
No symbol table info available.
#2  0x0000000800f01b9d in ?? () from /lib/libthr.so.3
No symbol table info available.
#3  0x00000000005ecb12 in ?? ()
No symbol table info available.
#4  0x00000000006a87a8 in ?? ()
No symbol table info available.
#5  0x0000000800f02d25 in ?? () from /lib/libthr.so.3
No symbol table info available.
#6  0x0000000000000000 in ?? ()
No symbol table info available.
Backtrace stopped: Cannot access memory at address 0x7fffdf9fb000

Thread 4 (LWP 925299 of process 75227 "FM#01"):
#0  0x0000000800efffdc in ?? () from /lib/libthr.so.3
No symbol table info available.
#1  0x0000000800f10022 in ?? () from /lib/libthr.so.3
No symbol table info available.
#2  0x0000000800f01b9d in ?? () from /lib/libthr.so.3
No symbol table info available.
#3  0x00000000005ec633 in ?? ()
No symbol table info available.
#4  0x00000000006a87a8 in ?? ()
No symbol table info available.
#5  0x0000000800f02d25 in ?? () from /lib/libthr.so.3
No symbol table info available.
#6  0x0000000000000000 in ?? ()
No symbol table info available.
Backtrace stopped: Cannot access memory at address 0x7fffdfbfc000

Thread 3 (LWP 925298 of process 75227 "W#01-vmx2"):
#0  0x00000008016be454 in exit () from /lib/libc.so.7
No symbol table info available.
#1  0x00000000006de629 in ?? ()
No symbol table info available.
#2  0x000000000061d9ac in ?? ()
No symbol table info available.
#3  0x000000000061ac4e in AppLayerProtoDetectGetProto ()
No symbol table info available.
#4  0x00000000006197c9 in ?? ()
No symbol table info available.
#5  0x0000000000619439 in AppLayerHandleTCPData ()
No symbol table info available.
--Type <RET> for more, q to quit, c to continue without paging--
#6  0x00000000005aee4a in StreamTcpReassembleAppLayer ()
No symbol table info available.
#7  0x00000000005af9e2 in StreamTcpReassembleHandleSegment ()
No symbol table info available.
#8  0x00000000005b2b9f in ?? ()
No symbol table info available.
#9  0x00000000005b15e2 in StreamTcpPacket ()
No symbol table info available.
#10 0x00000000005b7817 in StreamTcp ()
No symbol table info available.
#11 0x00000000006731c1 in ?? ()
No symbol table info available.
#12 0x0000000000672a1a in ?? ()
No symbol table info available.
#13 0x00000000006a5256 in TmThreadsSlotVarRun ()
No symbol table info available.
#14 0x000000000067409e in ?? ()
No symbol table info available.
#15 0x0000000801468ff4 in ?? () from /usr/local/lib/libpcap.so.1
No symbol table info available.
#16 0x00000000006737b7 in ?? ()
No symbol table info available.
#17 0x00000000006a83aa in ?? ()
No symbol table info available.
#18 0x0000000800f02d25 in ?? () from /lib/libthr.so.3
No symbol table info available.
#19 0x0000000000000000 in ?? ()
No symbol table info available.
Backtrace stopped: Cannot access memory at address 0x7fffdfdfd000

Thread 2 (LWP 924434 of process 75227 "IM#01"):
#0  0x000000080169a7ea in _read () from /lib/libc.so.7
No symbol table info available.
#1  0x0000000800f0ea13 in ?? () from /lib/libthr.so.3
No symbol table info available.
#2  0x00000000006355ed in AlertPfMonitorIfaceChanges ()
No symbol table info available.
#3  0x0000000800f02d25 in ?? () from /lib/libthr.so.3
No symbol table info available.
#4  0x0000000000000000 in ?? ()
No symbol table info available.
Backtrace stopped: Cannot access memory at address 0x7fffdfffe000

Thread 1 (LWP 100968 of process 75227 "Suricata-Main"):
#0  0x000000080169a6ea in _nanosleep () from /lib/libc.so.7
No symbol table info available.
#1  0x0000000800f0e82c in ?? () from /lib/libthr.so.3
No symbol table info available.
--Type <RET> for more, q to quit, c to continue without paging--
#2  0x000000080161ec46 in usleep () from /lib/libc.so.7
No symbol table info available.
#3  0x000000000059fa6a in ?? ()
No symbol table info available.
#4  0x000000000059f3b4 in SuricataMain ()
No symbol table info available.
#5  0x00000008015f06fa in __libc_start1 () from /lib/libc.so.7
No symbol table info available.
#6  0x000000000059bea0 in _start ()
No symbol table info available.
(gdb)
̿' ̿'\̵͇̿̿\з=(◕_◕)=ε/̵͇̿̿/'̿'̿ ̿
Please do not use chat/PM to ask for help
we must focus on silencing this @guest character. we must make up lies and alter the copyrights !
Don't forget to Upvote with the 👍 button for any post you find to be helpful. -
@jowe78 said in Suricata process dying due to hyperscan problem:
Hello,
I'm having the same problem.
I have 6 interfaces set up with Suricata. and only 2 of them are stopped randomly.
One using IX0 on WAN
And the other one using VLAN on IX1
device = '82599ES 10-Gigabit SFI/SFP+ Network Connection'
Using IPS Mode - Legacy ModeI deleted one of the monitored interfaces in Suricata that was having the issue, duplicated a working one. And got the same error on the new (same as before) interface. Also tried to disable some of the working ones but nothing changed.
Suricata log
[607907 - W#02] 2023-11-27 08:35:42 Error: spm-hs: Hyperscan returned fatal error -1.System log.
Nov 27 08:35:42 kernel ix0: promiscuous mode disabledThat is really puzzling. It is very hard to pin down what the root cause of this might be
 . Are the rules different on the interfaces with no issue compared to the interfaces that are crashing?
 -
@kiokoman said in Suricata process dying due to hyperscan problem:
106211 - Suricata-Main] 2023-11-27 13:12:52 Notice: threads: Threads created -> W: 1 FM: 1 FR: 1 Engine started.
[863533 - W#01-vmx2] 2023-11-27 13:12:53 Info: checksum: No packets with invalid checksum, assuming checksum offloading is NOT used
[863533 - W#01-vmx2] 2023-11-27 13:13:00 Error: spm-hs: Hyperscan returned fatal error -1.elfctl did not help for me
Hmm...I was sort of afraid that might be the result. Another user tried it and it seemed to work very briefly, but then a crash. The random nature of this bug is frustrating. It's happening with different physical interfaces, it happens immediately for some users (they can't even start an interface), but for other users it happens at random points during a long runtime.
@kiokoman said in Suricata process dying due to hyperscan problem:
how about vectorscan? there is plan for it?
Vectorscan is somethig Suricata upstream would have to incorporate into the binary. All we do on the pfSense side is take the upstream source code for the binary and add the custom blocking plugin for Legacy Blocking Mode.
I'm also unsure at this point what the support level is in Vectorscan for Intel devices. It was first developed to bring hyperscan-like technology to ARM and other non-Intel CPUs.
-
@chrysmon said in Suricata process dying due to hyperscan problem:
@jowe78 Have Suricata in IPS mode on the WAN interface. Had a crash once a day with hyperscan mode. Yesterday I switched to AK-CS mode and it crashed in half a day running. There is no error in logs.
Now I'm switching to AC-BS mode and keep you updated.There is no error in any log? Always check BOTH the pfSense system log under STATUS > SYSTEM LOGS and the
suricata.logunder the LOGS VIEW tab in the Suricata GUI.Different things are going to be logged in each. For example, if Suricata hard crashes, it can't log anything into
suricata.logabout the crash because the binary died suddenly. But the pfSense operating system will see the binary crash and log information about it in the pfSense system log. -
@bmeeks I wrote it explicitly because it was unusual: in system.log the last entry about suricata was a detection log. Nothing about crash.
Mine still running with AC-BS Matcher Algorithm. I even did a manual update, successful. -
@bmeeks said in Suricata process dying due to hyperscan problem:
That is really puzzling. It is very hard to pin down what the root cause of this might be
. Are the rules different on the interfaces with no issue compared to the interfaces that are crashing?I have all rulesets applied to all interfaces, but not all rules enabled. So there are exceptions, then some rules are disabled to ensure functionality. So there are differences
between the interfaces.I will start fresh on one of the interfaces to see how it works.
-
@bmeeks in my case, no (configured) variance between interfaces.
I recently removed Suricata, including all configuration, caches, logs, etc., and installed fresh. Created the first interface, then copied it to create the second. First interface seems to be stable, but the second will die fairly shortly after start, due to the aforementioned hyper scan problem.
-
I just removed the old, and set up 3 new suricata interfaces, let them run for a couple of hours in IDS. Disabling rules that breaks functionality. But as soon as i enabled IPS, the interface stopped 5min after start with the same error.
-
@asdjklfjkdslfdsaklj said in Suricata process dying due to hyperscan problem:
@bmeeks in my case, no (configured) variance between interfaces.
I recently removed Suricata, including all configuration, caches, logs, etc., and installed fresh. Created the first interface, then copied it to create the second. First interface seems to be stable, but the second will die fairly shortly after start, due to the aforementioned hyper scan problem.
That is just so weird! What should be two practically identical setups, yet one works and the other crashes. I honestly am running out of ideas at this point. There does not seem to be a common thread other than Hyperscan.
-
@bmeeks said in Suricata process dying due to hyperscan problem:
@asdjklfjkdslfdsaklj said in Suricata process dying due to hyperscan problem:
@bmeeks in my case, no (configured) variance between interfaces.
I recently removed Suricata, including all configuration, caches, logs, etc., and installed fresh. Created the first interface, then copied it to create the second. First interface seems to be stable, but the second will die fairly shortly after start, due to the aforementioned hyper scan problem.
That is just so weird! What should be two practically identical setups, yet one works and the other crashes. I honestly am running out of ideas at this point. There does not seem to be a common thread other than Hyperscan.
Indeed.
Initially created interface I mentioned just died, same hyper scan fatal error.
No expectations with regard to time and effort here, but if you need a methodical guinea pig say the word.
-
@asdjklfjkdslfdsaklj More than 1 day running without crash. With AC-BS Pattern Matcher Algorithm.
-
I Installed Snort to test, and there i get another error. Memory usage is at 57% out of 8GB with all snort interfaces running. So might be a little high.
I tried to change the "Stream Memory Cap" on Suricata interface (before changing to Snort) from 256MB to 384MB with no luck, Also changed some other memory settings without any luck.Is it using using a lot of RAM when reloading? It doesn't show on main page atleast.
Last log entries before crash, but it's not every time that i have disabled a rule that it has crashed, especially not for Suricata.
Nov 28 12:57:01 kernel ix0: promiscuous mode disabled
Nov 28 12:57:01 kernel pid 79776 (snort), jid 0, uid 0, was killed: failed to reclaim memory
Nov 28 12:56:59 kernel pid 79699 (snort), jid 0, uid 0, was killed: failed to reclaim memory
Nov 28 12:56:44 kernel pid 88772 (php-fpm), jid 0, uid 0, was killed: failed to reclaim memory
Nov 28 12:56:25 php-fpm 88772 [Snort] Snort RELOAD CONFIG for WAN(ix0)...
Nov 28 12:56:25 php-fpm 88772 [Snort] Building new sid-msg.map file for WAN...
Nov 28 12:56:25 php-fpm 88772 [Snort] Enabling any flowbit-required rules for: WAN...
Nov 28 12:56:24 php-fpm 88772 [Snort] Enabling any flowbit-required rules for: WAN...
Nov 28 12:56:23 php-fpm 88772 [Snort] Updating rules configuration for: WAN ...
Nov 28 12:56:23 check_reload_status 438 Syncing firewall
Nov 28 12:56:23 php-fpm 88772 /snort/snort_alerts.php: Configuration Change: admin@1.2.3.4 (Local Database): Snort pkg: User-forced rule state override applied for rule XXX:X on ALERTS tab for interface wan. -
@jowe78 said in Suricata process dying due to hyperscan problem:
Nov 28 12:57:01 kernel pid 79776 (snort), jid 0, uid 0, was killed: failed to reclaim memory
Nov 28 12:56:59 kernel pid 79699 (snort), jid 0, uid 0, was killed: failed to reclaim memory
Nov 28 12:56:44 kernel pid 88772 (php-fpm), jid 0, uid 0, was killed: failed to reclaim memoryThese log entries are very interesting ...
.I've been doing some research this morning on memory management in modern operating systems and FreeBSD in particular. Still not an expert in this area by any measure, but I've learned some things that make me suspect a memory allocation/reclamation bug may exist in the recent FreeBSD releases.
Memory management in a modern operating system such as FreeBSD is quite complex. There are several memory area classifications explained here.
The operating system can experience something known as "memory pressure". This is a condition where some process needs additional memory but there is currently no Free memory available (refer to the link a couple of sentences prior in this paragraph for the definition of Free). In this state, the kernel memory management algorithm goes on the hunt for memory it can reclaim and then give to the requesting process. The kernel does its best to find memory to give a requesting process instead of just simply returning an OOM (out-of-memory) error to the requester. It first looks for a process that is sleeping, and if it finds a suitable one, it will either reclaim that memory space temporarily or swap that process' memory out to the swap partition. But if there is no sleeping process and the kernel can't otherwise find memory for the process currently requesting it, it will go on the hunt for something to kill in order to obtain memory. It is possible in that scenario for it to choose one of the largest memory consumption processes to kill.
So, back to the log entries. Snort will be using a lot of extra memory during the rules update process. And it will be using a good chunk of that memory through the PHP interpreter. Look at the log entries I quoted above and notice what processes were killed:
snortand thephp-fpmengine. These would have been the biggest current memory users. But curiously, it was these processes that were likely asking for additional memory.I've seen a number of posts since the recent pfSense Plus release and the 2.7.1 CE release with similar log errors. Commonly impacted programs are
unboundandsnort. But sometimes a few others. The use of ZFS and its ARC (Adaptive Replacement Cache) might play a role here, too.This post I found does a decent job of explaining how memory management in FreeBSD works: https://unix.stackexchange.com/questions/234446/how-does-freebsd-allocate-memory.
-
@bmeeks said in Suricata process dying due to hyperscan problem:
@jowe78 said in Suricata process dying due to hyperscan problem:
Nov 28 12:57:01 kernel pid 79776 (snort), jid 0, uid 0, was killed: failed to reclaim memory
Nov 28 12:56:59 kernel pid 79699 (snort), jid 0, uid 0, was killed: failed to reclaim memory
Nov 28 12:56:44 kernel pid 88772 (php-fpm), jid 0, uid 0, was killed: failed to reclaim memoryThese log entries are very interesting ...
.I've been doing some research this morning on memory management in modern operating systems and FreeBSD in particular. Still not an expert in this area by any measure, but I've learned some things that make me suspect a memory allocation/reclamation bug may exist in the recent FreeBSD releases.
Memory management in a modern operating system such as FreeBSD is quite complex. There are several memory area classifications explained here.
The operating system can experience something known as "memory pressure". This is a condition where some process needs additional memory but there is currently no Free memory available (refer to the link a couple of sentences prior in this paragraph for the definition of Free). In this state, the kernel memory management algorithm goes on the hunt for memory it can reclaim and then give to the requesting process. The kernel does its best to find memory to give a requesting process instead of just simply returning an OOM (out-of-memory) error to the requester. It first looks for a process that is sleeping, and if it finds a suitable one, it will either reclaim that memory space temporarily or swap that process' memory out to the swap partition. But if there is no sleeping process and the kernel can't otherwise find memory for the process currently requesting it, it will go on the hunt for something to kill in order to obtain memory. It is possible in that scenario for it to choose one of the largest memory consumption processes to kill.
So, back to the log entries. Snort will be using a lot of extra memory during the rules update process. And it will be using a good chunk of that memory through the PHP interpreter. Look at the log entries I quoted above and notice what processes were killed:
snortand thephp-fpmengine. These would have been the biggest current memory users. But curiously, it was these processes that were likely asking for additional memory.I've seen a number of posts since the recent pfSense Plus release and the 2.7.1 CE release with similar log errors. Commonly impacted programs are
unboundandsnort. But sometimes a few others. The use of ZFS and its ARC (Adaptive Replacement Cache) might play a role here, too.This post I found does a decent job of explaining how memory management in FreeBSD works: https://unix.stackexchange.com/questions/234446/how-does-freebsd-allocate-memory.
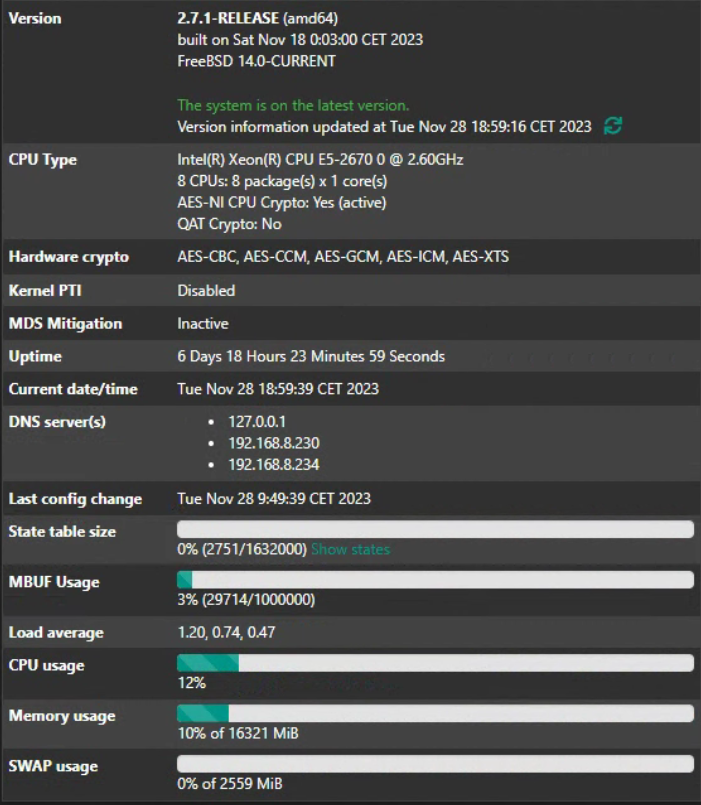
Let me share my experience about memory. The same configuration running on three different physical systems:
- With 16GB RAM: uses the swap partition, the performance is unacceptable
- With 32GB RAM uses about 50% (peaks at 54%), no swap
- With 64GB RAM uses about 7%, no swap
The values are from System Information - Memory usage
-
S SteveITS referenced this topic on
-
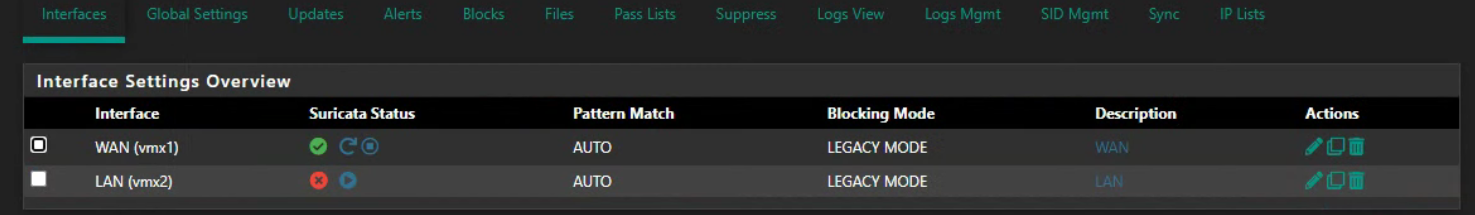
LAN is cloned from WAN, there is no difference but wan is stable ...
̿' ̿'\̵͇̿̿\з=(◕_◕)=ε/̵͇̿̿/'̿'̿ ̿
Please do not use chat/PM to ask for help
we must focus on silencing this @guest character. we must make up lies and alter the copyrights !
Don't forget to Upvote with the 👍 button for any post you find to be helpful.