Suricata process dying due to hyperscan problem
-
@bmeeks said in Suricata process dying due to hyperscan problem:
@jowe78 said in Suricata process dying due to hyperscan problem:
Nov 28 12:57:01 kernel pid 79776 (snort), jid 0, uid 0, was killed: failed to reclaim memory
Nov 28 12:56:59 kernel pid 79699 (snort), jid 0, uid 0, was killed: failed to reclaim memory
Nov 28 12:56:44 kernel pid 88772 (php-fpm), jid 0, uid 0, was killed: failed to reclaim memoryThese log entries are very interesting ...
 .
.I've been doing some research this morning on memory management in modern operating systems and FreeBSD in particular. Still not an expert in this area by any measure, but I've learned some things that make me suspect a memory allocation/reclamation bug may exist in the recent FreeBSD releases.
Memory management in a modern operating system such as FreeBSD is quite complex. There are several memory area classifications explained here.
The operating system can experience something known as "memory pressure". This is a condition where some process needs additional memory but there is currently no Free memory available (refer to the link a couple of sentences prior in this paragraph for the definition of Free). In this state, the kernel memory management algorithm goes on the hunt for memory it can reclaim and then give to the requesting process. The kernel does its best to find memory to give a requesting process instead of just simply returning an OOM (out-of-memory) error to the requester. It first looks for a process that is sleeping, and if it finds a suitable one, it will either reclaim that memory space temporarily or swap that process' memory out to the swap partition. But if there is no sleeping process and the kernel can't otherwise find memory for the process currently requesting it, it will go on the hunt for something to kill in order to obtain memory. It is possible in that scenario for it to choose one of the largest memory consumption processes to kill.
So, back to the log entries. Snort will be using a lot of extra memory during the rules update process. And it will be using a good chunk of that memory through the PHP interpreter. Look at the log entries I quoted above and notice what processes were killed:
snortand thephp-fpmengine. These would have been the biggest current memory users. But curiously, it was these processes that were likely asking for additional memory.I've seen a number of posts since the recent pfSense Plus release and the 2.7.1 CE release with similar log errors. Commonly impacted programs are
unboundandsnort. But sometimes a few others. The use of ZFS and its ARC (Adaptive Replacement Cache) might play a role here, too.This post I found does a decent job of explaining how memory management in FreeBSD works: https://unix.stackexchange.com/questions/234446/how-does-freebsd-allocate-memory.
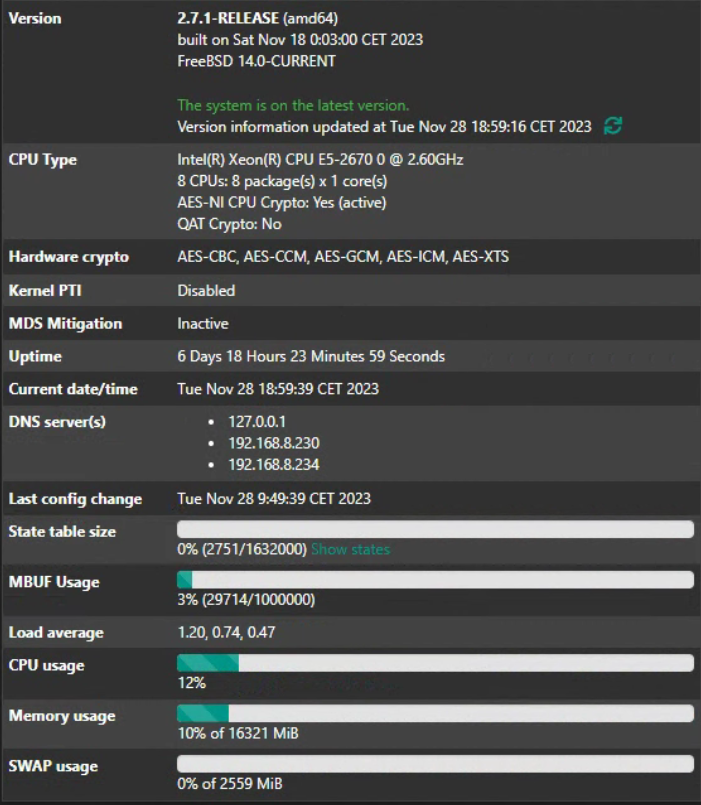
Let me share my experience about memory. The same configuration running on three different physical systems:
- With 16GB RAM: uses the swap partition, the performance is unacceptable
- With 32GB RAM uses about 50% (peaks at 54%), no swap
- With 64GB RAM uses about 7%, no swap
The values are from System Information - Memory usage
-
S SteveITS referenced this topic on
-
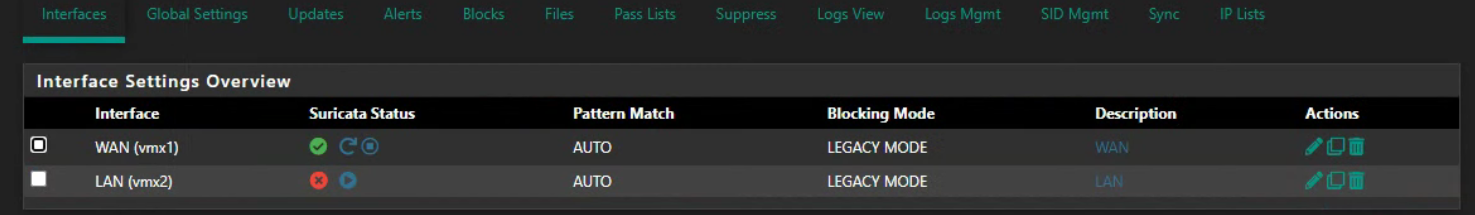
LAN is cloned from WAN, there is no difference but wan is stable ...
̿' ̿'\̵͇̿̿\з=(◕_◕)=ε/̵͇̿̿/'̿'̿ ̿
Please do not use chat/PM to ask for help
we must focus on silencing this @guest character. we must make up lies and alter the copyrights !
Don't forget to Upvote with the 👍 button for any post you find to be helpful. -
@kiokoman Weird, some difference in the private subnet or related pass list maybe?
@chrysmon said in Suricata process dying due to hyperscan problem:
With 16GB RAM: uses the swap partition, the performance is unacceptable
With 32GB RAM uses about 50% (peaks at 54%), no swapHave you found https://docs.netgate.com/pfsense/en/latest/hardware/tune-zfs.html?
"The default maximum ARC size (vfs.zfs.arc.max) is automatic (0) and uses 1/2 RAM or the total RAM minus 1GB, whichever is greater."
(but also it's supposed to give it up on its own) -
@kiokoman said in Suricata process dying due to hyperscan problem:
LAN is cloned from WAN, there is no difference but wan is stable ...
Does turning Blocking Mode off completely make any difference on the LAN interface?
-
@SteveITS said in Suricata process dying due to hyperscan problem:
@kiokoman Weird, some difference in the private subnet or related pass list maybe?
@chrysmon said in Suricata process dying due to hyperscan problem:
With 16GB RAM: uses the swap partition, the performance is unacceptable
With 32GB RAM uses about 50% (peaks at 54%), no swapHave you found https://docs.netgate.com/pfsense/en/latest/hardware/tune-zfs.html?
"The default maximum ARC size (vfs.zfs.arc.max) is automatic (0) and uses 1/2 RAM or the total RAM minus 1GB, whichever is greater."
(but also it's supposed to give it up on its own)No I haven't. The strange (for me) is the low usage when the machine has 64GB. It's not consistent with the other two cases.
Sorry to continue here a discussion not relevant to the topic. -
I seem to have solved my problems by going from 8GB to 16GB RAM. Topped out at 65% or something with 16GB, But wasn't much higher with 8GB in %. (Going back to Suricata, memory usage is around 30% again)
Before there were some strange hanged apps like ovpn and adguard.
I just replaced the hardware, and looked at the usage on my old system eith 16GB RAM, and that was using like 30% so i thought that 8GB would be fine. But apparently not.
Thanks!
-
@jowe78 Just to be clear: in my case suricata stopped crashing after setting the Pattern Matcher to AC-BS. Still may be early to conclude, but before (with any other Algorithm) it had crashes. I will let it one more day and then set to Hyperscan again.
-
@chrysmon said in Suricata process dying due to hyperscan problem:
in my case suricata stopped crashing after setting the Pattern Matcher to AC-BS
I changed back so still using hyperscan (or auto), just more RAM.
-
@bmeeks
turning Blocking mode to off make it stable -
@kiokoman said in Suricata process dying due to hyperscan problem:
@bmeeks
turning Blocking mode to off make it stableJust to be clear. I am trying to determine if there is any link between Blocking being enabled and the Hyperscan crash.
You said your WAN was stable with blocking enabled, but your LAN (with the same rules cloned from the WAN interface and blocking enabled) would not even start. So, I want you to disable blocking mode on the LAN interface only and see if Suricata then starts on your LAN.
Then, if you LAN interface starts up with no other changes besides disabling blocking mode, then enable blocking mode again and see if the startup crash returns.
Perhaps I misunderstood your statement, though. Do you mean your LAN interfaces starts but then randomly crashes later, or does it fail to even start? Either way, removing Blocking Mode as a variable will be helpful.
The idea is to see if blocking mode is in any way related to the Hyperscan crash. I don't really believe it is, but since I have not been able to reproduce this crash I must depend on the users having the issue to help me understand where it's coming from.
-
@bmeeks
WAN is stable with blocking enabledLAN interfaces starts but then randomly crashes after a few minutes (max 5 min)
LAN interface stay up and running if i disable blocking mode
another BT running in autofp mode
(gdb) b exit
Breakpoint 1 at 0x82f969454
(gdb) continue
Continuing.
[New LWP 561670 of process 86533]
[New LWP 561671 of process 86533]
[New LWP 561672 of process 86533]
[New LWP 561673 of process 86533]
[New LWP 561674 of process 86533]
[New LWP 561675 of process 86533]
[New LWP 561676 of process 86533]
[New LWP 561677 of process 86533]
[New LWP 561678 of process 86533]
[New LWP 561679 of process 86533]
[New LWP 561680 of process 86533]
[Switching to LWP 561677 of process 86533]Thread 10 "W#07" hit Breakpoint 1, 0x000000082f969454 in exit () from /lib/libc.so.7
(gdb) bt
#0 0x000000082f969454 in exit () from /lib/libc.so.7
#1 0x00000000006de629 in ?? ()
#2 0x000000000061d9ac in ?? ()
#3 0x000000000061ac4e in AppLayerProtoDetectGetProto ()
#4 0x00000000006197c9 in ?? ()
#5 0x0000000000619439 in AppLayerHandleTCPData ()
#6 0x00000000005aee4a in StreamTcpReassembleAppLayer ()
#7 0x00000000005af9e2 in StreamTcpReassembleHandleSegment ()
#8 0x00000000005b2b9f in ?? ()
#9 0x00000000005b15e2 in StreamTcpPacket ()
#10 0x00000000005b7817 in StreamTcp ()
#11 0x00000000006731c1 in ?? ()
#12 0x0000000000672a1a in ?? ()
#13 0x00000000006a7fe7 in ?? ()
#14 0x000000082b0b3d25 in ?? () from /lib/libthr.so.3
#15 0x0000000000000000 in ?? ()
Backtrace stopped: Cannot access memory at address 0x839de8000
(gdb) bt full
#0 0x000000082f969454 in exit () from /lib/libc.so.7
No symbol table info available.
#1 0x00000000006de629 in ?? ()
No symbol table info available.
#2 0x000000000061d9ac in ?? ()
No symbol table info available.
#3 0x000000000061ac4e in AppLayerProtoDetectGetProto ()
No symbol table info available.
#4 0x00000000006197c9 in ?? ()
No symbol table info available.
#5 0x0000000000619439 in AppLayerHandleTCPData ()
No symbol table info available.
#6 0x00000000005aee4a in StreamTcpReassembleAppLayer ()
No symbol table info available.
#7 0x00000000005af9e2 in StreamTcpReassembleHandleSegment ()
No symbol table info available.
#8 0x00000000005b2b9f in ?? ()
No symbol table info available.
#9 0x00000000005b15e2 in StreamTcpPacket ()
No symbol table info available.
#10 0x00000000005b7817 in StreamTcp ()
No symbol table info available.
#11 0x00000000006731c1 in ?? ()
No symbol table info available.
#12 0x0000000000672a1a in ?? ()
No symbol table info available.
#13 0x00000000006a7fe7 in ?? ()
No symbol table info available.
#14 0x000000082b0b3d25 in ?? () from /lib/libthr.so.3
No symbol table info available.
#15 0x0000000000000000 in ?? ()
No symbol table info available.
Backtrace stopped: Cannot access memory at address 0x839de8000
(gdb) info threads
Id Target Id Frame
1 LWP 100234 of process 86533 0x000000082f9456ea in _nanosleep () from /lib/libc.so.7
2 LWP 561146 of process 86533 "IM#01" 0x000000082f9457ea in _read () from /lib/libc.so.7
3 LWP 561670 of process 86533 "RX#01-vmx2" 0x000000082f9446aa in _umtx_op () from /lib/libc.so.7
4 LWP 561671 of process 86533 "W#01" 0x000000082b0b0fdc in ?? () from /lib/libthr.so.3
5 LWP 561672 of process 86533 "W#02" 0x000000082b0b0fdc in ?? () from /lib/libthr.so.3
6 LWP 561673 of process 86533 "W#03" 0x0000000000672490 in ?? ()
7 LWP 561674 of process 86533 "W#04" 0x0000000000671127 in ?? ()
8 LWP 561675 of process 86533 "W#05" 0x000000082b0b0fdc in ?? () from /lib/libthr.so.3
9 LWP 561676 of process 86533 "W#06" 0x000000082ddb9d48 in ?? () from /usr/local/lib/libhs.so.5- 10 LWP 561677 of process 86533 "W#07" 0x000000082f969454 in exit () from /lib/libc.so.7
11 LWP 561678 of process 86533 "W#08" 0x00000000005a44d1 in DetectEnginePktInspectionRun ()
12 LWP 561679 of process 86533 "FM#01" 0x000000082b0b0fdc in ?? () from /lib/libthr.so.3
13 LWP 561680 of process 86533 "FR#01" 0x000000082b0b0fdc in ?? () from /lib/libthr.so.3
(gdb) thread apply all bt
Thread 13 (LWP 561680 of process 86533 "FR#01"):
#0 0x000000082b0b0fdc in ?? () from /lib/libthr.so.3
#1 0x000000082b0c1022 in ?? () from /lib/libthr.so.3
#2 0x000000082b0b2b9d in ?? () from /lib/libthr.so.3
#3 0x00000000005ecb12 in ?? ()
#4 0x00000000006a87a8 in ?? ()
#5 0x000000082b0b3d25 in ?? () from /lib/libthr.so.3
#6 0x0000000000000000 in ?? ()
Backtrace stopped: Cannot access memory at address 0x83c301000Thread 12 (LWP 561679 of process 86533 "FM#01"):
#0 0x000000082b0b0fdc in ?? () from /lib/libthr.so.3
#1 0x000000082b0c1022 in ?? () from /lib/libthr.so.3
#2 0x000000082b0b2b9d in ?? () from /lib/libthr.so.3
#3 0x00000000005ec633 in ?? ()
#4 0x00000000006a87a8 in ?? ()
#5 0x000000082b0b3d25 in ?? () from /lib/libthr.so.3
#6 0x0000000000000000 in ?? ()
Backtrace stopped: Cannot access memory at address 0x83b685000Thread 11 (LWP 561678 of process 86533 "W#08"):
#0 0x00000000005a44d1 in DetectEnginePktInspectionRun ()
#1 0x000000000067114b in ?? ()
#2 0x00000000006706db in Detect ()
#3 0x0000000000672ac9 in ?? ()
#4 0x00000000006a7fe7 in ?? ()
#5 0x000000082b0b3d25 in ?? () from /lib/libthr.so.3
#6 0x0000000000000000 in ?? ()
Backtrace stopped: Cannot access memory at address 0x83a717000Thread 10 (LWP 561677 of process 86533 "W#07"):
#0 0x000000082f969454 in exit () from /lib/libc.so.7
#1 0x00000000006de629 in ?? ()
#2 0x000000000061d9ac in ?? ()
#3 0x000000000061ac4e in AppLayerProtoDetectGetProto ()
#4 0x00000000006197c9 in ?? ()
#5 0x0000000000619439 in AppLayerHandleTCPData ()
#6 0x00000000005aee4a in StreamTcpReassembleAppLayer ()
#7 0x00000000005af9e2 in StreamTcpReassembleHandleSegment ()
#8 0x00000000005b2b9f in ?? ()
#9 0x00000000005b15e2 in StreamTcpPacket ()
#10 0x00000000005b7817 in StreamTcp ()
#11 0x00000000006731c1 in ?? ()
#12 0x0000000000672a1a in ?? ()
#13 0x00000000006a7fe7 in ?? ()
#14 0x000000082b0b3d25 in ?? () from /lib/libthr.so.3
#15 0x0000000000000000 in ?? ()
--Type <RET> for more, q to quit, c to continue without paging--
Backtrace stopped: Cannot access memory at address 0x839de8000Thread 9 (LWP 561676 of process 86533 "W#06"):
#0 0x000000082ddb9d48 in ?? () from /usr/local/lib/libhs.so.5
#1 0x000000082dde6ed3 in ?? () from /usr/local/lib/libhs.so.5
#2 0x000000082dd33a87 in hs_scan () from /usr/local/lib/libhs.so.5
#3 0x00000000006d4050 in SCHSSearch ()
#4 0x00000000005cc6fe in Prefilter ()
#5 0x0000000000670e15 in ?? ()
#6 0x00000000006706db in Detect ()
#7 0x0000000000672ac9 in ?? ()
#8 0x00000000006a7fe7 in ?? ()
#9 0x000000082b0b3d25 in ?? () from /lib/libthr.so.3
#10 0x0000000000000000 in ?? ()
Backtrace stopped: Cannot access memory at address 0x839723000Thread 8 (LWP 561675 of process 86533 "W#05"):
#0 0x000000082b0b0fdc in ?? () from /lib/libthr.so.3
#1 0x000000082b0b8f56 in pthread_mutex_unlock () from /lib/libthr.so.3
#2 0x000000082b0b2730 in __pthread_cleanup_pop_imp () from /lib/libthr.so.3
#3 0x000000082f929e2a in vfprintf_l () from /lib/libc.so.7
#4 0x000000082f9228df in fprintf () from /lib/libc.so.7
#5 0x00000000006b071e in SCLogMessage ()
#6 0x00000000006b13b6 in SCLogErr ()
#7 0x00000000006de61f in ?? ()
#8 0x000000000061d9ac in ?? ()
#9 0x000000000061ac4e in AppLayerProtoDetectGetProto ()
#10 0x00000000006197c9 in ?? ()
#11 0x0000000000619439 in AppLayerHandleTCPData ()
#12 0x00000000005aee4a in StreamTcpReassembleAppLayer ()
#13 0x00000000005af9e2 in StreamTcpReassembleHandleSegment ()
#14 0x00000000005b2b9f in ?? ()
#15 0x00000000005b15e2 in StreamTcpPacket ()
#16 0x00000000005b7817 in StreamTcp ()
#17 0x00000000006731c1 in ?? ()
#18 0x0000000000672a1a in ?? ()
#19 0x00000000006a7fe7 in ?? ()
#20 0x000000082b0b3d25 in ?? () from /lib/libthr.so.3
#21 0x0000000000000000 in ?? ()
Backtrace stopped: Cannot access memory at address 0x839405000Thread 7 (LWP 561674 of process 86533 "W#04"):
#0 0x0000000000671127 in ?? ()
#1 0x00000000006706db in Detect ()
#2 0x0000000000672ac9 in ?? ()
#3 0x00000000006a7fe7 in ?? ()
#4 0x000000082b0b3d25 in ?? () from /lib/libthr.so.3
#5 0x0000000000000000 in ?? ()
--Type <RET> for more, q to quit, c to continue without paging--
Backtrace stopped: Cannot access memory at address 0x839183000Thread 6 (LWP 561673 of process 86533 "W#03"):
#0 0x0000000000672490 in ?? ()
#1 0x0000000000671118 in ?? ()
#2 0x00000000006706db in Detect ()
#3 0x0000000000672ac9 in ?? ()
#4 0x00000000006a7fe7 in ?? ()
#5 0x000000082b0b3d25 in ?? () from /lib/libthr.so.3
#6 0x0000000000000000 in ?? ()
Backtrace stopped: Cannot access memory at address 0x838061000Thread 5 (LWP 561672 of process 86533 "W#02"):
#0 0x000000082b0b0fdc in ?? () from /lib/libthr.so.3
#1 0x000000082b0c1022 in ?? () from /lib/libthr.so.3
#2 0x000000082b0b2b9d in ?? () from /lib/libthr.so.3
#3 0x00000000006a3cc9 in TmqhInputFlow ()
#4 0x00000000006a7fb3 in ?? ()
#5 0x000000082b0b3d25 in ?? () from /lib/libthr.so.3
#6 0x0000000000000000 in ?? ()
Backtrace stopped: Cannot access memory at address 0x8371ba000Thread 4 (LWP 561671 of process 86533 "W#01"):
#0 0x000000082b0b0fdc in ?? () from /lib/libthr.so.3
#1 0x000000082b0c1022 in ?? () from /lib/libthr.so.3
#2 0x000000082b0b2b9d in ?? () from /lib/libthr.so.3
#3 0x00000000006a3cc9 in TmqhInputFlow ()
#4 0x00000000006a7fb3 in ?? ()
#5 0x000000082b0b3d25 in ?? () from /lib/libthr.so.3
#6 0x0000000000000000 in ?? ()
Backtrace stopped: Cannot access memory at address 0x83620c000Thread 3 (LWP 561670 of process 86533 "RX#01-vmx2"):
#0 0x000000082f9446aa in _umtx_op () from /lib/libc.so.7
#1 0x000000082b0b8f75 in pthread_mutex_unlock () from /lib/libthr.so.3
#2 0x00000000006740b1 in ?? ()
#3 0x000000082c1f4ff4 in ?? () from /usr/local/lib/libpcap.so.1
#4 0x00000000006737b7 in ?? ()
#5 0x00000000006a83aa in ?? ()
#6 0x000000082b0b3d25 in ?? () from /lib/libthr.so.3
#7 0x0000000000000000 in ?? ()
Backtrace stopped: Cannot access memory at address 0x835349000Thread 2 (LWP 561146 of process 86533 "IM#01"):
#0 0x000000082f9457ea in _read () from /lib/libc.so.7
#1 0x000000082b0bfa13 in ?? () from /lib/libthr.so.3
#2 0x00000000006355ed in AlertPfMonitorIfaceChanges ()
#3 0x000000082b0b3d25 in ?? () from /lib/libthr.so.3
--Type <RET> for more, q to quit, c to continue without paging--
#4 0x0000000000000000 in ?? ()
Backtrace stopped: Cannot access memory at address 0x83423d000Thread 1 (LWP 100234 of process 86533):
#0 0x000000082f9456ea in _nanosleep () from /lib/libc.so.7
#1 0x000000082b0bf82c in ?? () from /lib/libthr.so.3
#2 0x000000082f8c9c46 in usleep () from /lib/libc.so.7
#3 0x000000000059fa6a in ?? ()
#4 0x000000000059f3b4 in SuricataMain ()
#5 0x000000082f89b6fa in __libc_start1 () from /lib/libc.so.7
#6 0x000000000059bea0 in _start ()
(gdb) thread apply all bt fullThread 13 (LWP 561680 of process 86533 "FR#01"):
#0 0x000000082b0b0fdc in ?? () from /lib/libthr.so.3
No symbol table info available.
#1 0x000000082b0c1022 in ?? () from /lib/libthr.so.3
No symbol table info available.
#2 0x000000082b0b2b9d in ?? () from /lib/libthr.so.3
No symbol table info available.
#3 0x00000000005ecb12 in ?? ()
No symbol table info available.
#4 0x00000000006a87a8 in ?? ()
No symbol table info available.
#5 0x000000082b0b3d25 in ?? () from /lib/libthr.so.3
No symbol table info available.
#6 0x0000000000000000 in ?? ()
No symbol table info available.
Backtrace stopped: Cannot access memory at address 0x83c301000Thread 12 (LWP 561679 of process 86533 "FM#01"):
#0 0x000000082b0b0fdc in ?? () from /lib/libthr.so.3
No symbol table info available.
#1 0x000000082b0c1022 in ?? () from /lib/libthr.so.3
No symbol table info available.
#2 0x000000082b0b2b9d in ?? () from /lib/libthr.so.3
No symbol table info available.
#3 0x00000000005ec633 in ?? ()
No symbol table info available.
#4 0x00000000006a87a8 in ?? ()
No symbol table info available.
#5 0x000000082b0b3d25 in ?? () from /lib/libthr.so.3
No symbol table info available.
#6 0x0000000000000000 in ?? ()
No symbol table info available.
Backtrace stopped: Cannot access memory at address 0x83b685000Thread 11 (LWP 561678 of process 86533 "W#08"):
#0 0x00000000005a44d1 in DetectEnginePktInspectionRun ()
No symbol table info available.
#1 0x000000000067114b in ?? ()
No symbol table info available.
#2 0x00000000006706db in Detect ()
No symbol table info available.
#3 0x0000000000672ac9 in ?? ()
No symbol table info available.
#4 0x00000000006a7fe7 in ?? ()
No symbol table info available.
#5 0x000000082b0b3d25 in ?? () from /lib/libthr.so.3
No symbol table info available.
--Type <RET> for more, q to quit, c to continue without paging--
#6 0x0000000000000000 in ?? ()
No symbol table info available.
Backtrace stopped: Cannot access memory at address 0x83a717000Thread 10 (LWP 561677 of process 86533 "W#07"):
#0 0x000000082f969454 in exit () from /lib/libc.so.7
No symbol table info available.
#1 0x00000000006de629 in ?? ()
No symbol table info available.
#2 0x000000000061d9ac in ?? ()
No symbol table info available.
#3 0x000000000061ac4e in AppLayerProtoDetectGetProto ()
No symbol table info available.
#4 0x00000000006197c9 in ?? ()
No symbol table info available.
#5 0x0000000000619439 in AppLayerHandleTCPData ()
No symbol table info available.
#6 0x00000000005aee4a in StreamTcpReassembleAppLayer ()
No symbol table info available.
#7 0x00000000005af9e2 in StreamTcpReassembleHandleSegment ()
No symbol table info available.
#8 0x00000000005b2b9f in ?? ()
No symbol table info available.
#9 0x00000000005b15e2 in StreamTcpPacket ()
No symbol table info available.
#10 0x00000000005b7817 in StreamTcp ()
No symbol table info available.
#11 0x00000000006731c1 in ?? ()
No symbol table info available.
#12 0x0000000000672a1a in ?? ()
No symbol table info available.
#13 0x00000000006a7fe7 in ?? ()
No symbol table info available.
#14 0x000000082b0b3d25 in ?? () from /lib/libthr.so.3
No symbol table info available.
#15 0x0000000000000000 in ?? ()
No symbol table info available.
Backtrace stopped: Cannot access memory at address 0x839de8000Thread 9 (LWP 561676 of process 86533 "W#06"):
#0 0x000000082ddb9d48 in ?? () from /usr/local/lib/libhs.so.5
No symbol table info available.
#1 0x000000082dde6ed3 in ?? () from /usr/local/lib/libhs.so.5
No symbol table info available.
#2 0x000000082dd33a87 in hs_scan () from /usr/local/lib/libhs.so.5
No symbol table info available.
#3 0x00000000006d4050 in SCHSSearch ()
No symbol table info available.
--Type <RET> for more, q to quit, c to continue without paging--
#4 0x00000000005cc6fe in Prefilter ()
No symbol table info available.
#5 0x0000000000670e15 in ?? ()
No symbol table info available.
#6 0x00000000006706db in Detect ()
No symbol table info available.
#7 0x0000000000672ac9 in ?? ()
No symbol table info available.
#8 0x00000000006a7fe7 in ?? ()
No symbol table info available.
#9 0x000000082b0b3d25 in ?? () from /lib/libthr.so.3
No symbol table info available.
#10 0x0000000000000000 in ?? ()
No symbol table info available.
Backtrace stopped: Cannot access memory at address 0x839723000Thread 8 (LWP 561675 of process 86533 "W#05"):
#0 0x000000082b0b0fdc in ?? () from /lib/libthr.so.3
No symbol table info available.
#1 0x000000082b0b8f56 in pthread_mutex_unlock () from /lib/libthr.so.3
No symbol table info available.
#2 0x000000082b0b2730 in __pthread_cleanup_pop_imp () from /lib/libthr.so.3
No symbol table info available.
#3 0x000000082f929e2a in vfprintf_l () from /lib/libc.so.7
No symbol table info available.
#4 0x000000082f9228df in fprintf () from /lib/libc.so.7
No symbol table info available.
#5 0x00000000006b071e in SCLogMessage ()
No symbol table info available.
#6 0x00000000006b13b6 in SCLogErr ()
No symbol table info available.
#7 0x00000000006de61f in ?? ()
No symbol table info available.
#8 0x000000000061d9ac in ?? ()
No symbol table info available.
#9 0x000000000061ac4e in AppLayerProtoDetectGetProto ()
No symbol table info available.
#10 0x00000000006197c9 in ?? ()
No symbol table info available.
#11 0x0000000000619439 in AppLayerHandleTCPData ()
No symbol table info available.
#12 0x00000000005aee4a in StreamTcpReassembleAppLayer ()
No symbol table info available.
#13 0x00000000005af9e2 in StreamTcpReassembleHandleSegment ()
No symbol table info available.
#14 0x00000000005b2b9f in ?? ()
No symbol table info available.
#15 0x00000000005b15e2 in StreamTcpPacket ()
--Type <RET> for more, q to quit, c to continue without paging--
No symbol table info available.
#16 0x00000000005b7817 in StreamTcp ()
No symbol table info available.
#17 0x00000000006731c1 in ?? ()
No symbol table info available.
#18 0x0000000000672a1a in ?? ()
No symbol table info available.
#19 0x00000000006a7fe7 in ?? ()
No symbol table info available.
#20 0x000000082b0b3d25 in ?? () from /lib/libthr.so.3
No symbol table info available.
#21 0x0000000000000000 in ?? ()
No symbol table info available.
Backtrace stopped: Cannot access memory at address 0x839405000Thread 7 (LWP 561674 of process 86533 "W#04"):
#0 0x0000000000671127 in ?? ()
No symbol table info available.
#1 0x00000000006706db in Detect ()
No symbol table info available.
#2 0x0000000000672ac9 in ?? ()
No symbol table info available.
#3 0x00000000006a7fe7 in ?? ()
No symbol table info available.
#4 0x000000082b0b3d25 in ?? () from /lib/libthr.so.3
No symbol table info available.
#5 0x0000000000000000 in ?? ()
No symbol table info available.
Backtrace stopped: Cannot access memory at address 0x839183000Thread 6 (LWP 561673 of process 86533 "W#03"):
#0 0x0000000000672490 in ?? ()
No symbol table info available.
#1 0x0000000000671118 in ?? ()
No symbol table info available.
#2 0x00000000006706db in Detect ()
No symbol table info available.
#3 0x0000000000672ac9 in ?? ()
No symbol table info available.
#4 0x00000000006a7fe7 in ?? ()
No symbol table info available.
#5 0x000000082b0b3d25 in ?? () from /lib/libthr.so.3
No symbol table info available.
#6 0x0000000000000000 in ?? ()
No symbol table info available.
Backtrace stopped: Cannot access memory at address 0x838061000Thread 5 (LWP 561672 of process 86533 "W#02"):
--Type <RET> for more, q to quit, c to continue without paging--
#0 0x000000082b0b0fdc in ?? () from /lib/libthr.so.3
No symbol table info available.
#1 0x000000082b0c1022 in ?? () from /lib/libthr.so.3
No symbol table info available.
#2 0x000000082b0b2b9d in ?? () from /lib/libthr.so.3
No symbol table info available.
#3 0x00000000006a3cc9 in TmqhInputFlow ()
No symbol table info available.
#4 0x00000000006a7fb3 in ?? ()
No symbol table info available.
#5 0x000000082b0b3d25 in ?? () from /lib/libthr.so.3
No symbol table info available.
#6 0x0000000000000000 in ?? ()
No symbol table info available.
Backtrace stopped: Cannot access memory at address 0x8371ba000Thread 4 (LWP 561671 of process 86533 "W#01"):
#0 0x000000082b0b0fdc in ?? () from /lib/libthr.so.3
No symbol table info available.
#1 0x000000082b0c1022 in ?? () from /lib/libthr.so.3
No symbol table info available.
#2 0x000000082b0b2b9d in ?? () from /lib/libthr.so.3
No symbol table info available.
#3 0x00000000006a3cc9 in TmqhInputFlow ()
No symbol table info available.
#4 0x00000000006a7fb3 in ?? ()
No symbol table info available.
#5 0x000000082b0b3d25 in ?? () from /lib/libthr.so.3
No symbol table info available.
#6 0x0000000000000000 in ?? ()
No symbol table info available.
Backtrace stopped: Cannot access memory at address 0x83620c000Thread 3 (LWP 561670 of process 86533 "RX#01-vmx2"):
#0 0x000000082f9446aa in _umtx_op () from /lib/libc.so.7
No symbol table info available.
#1 0x000000082b0b8f75 in pthread_mutex_unlock () from /lib/libthr.so.3
No symbol table info available.
#2 0x00000000006740b1 in ?? ()
No symbol table info available.
#3 0x000000082c1f4ff4 in ?? () from /usr/local/lib/libpcap.so.1
No symbol table info available.
#4 0x00000000006737b7 in ?? ()
No symbol table info available.
#5 0x00000000006a83aa in ?? ()
No symbol table info available.
#6 0x000000082b0b3d25 in ?? () from /lib/libthr.so.3
No symbol table info available.
--Type <RET> for more, q to quit, c to continue without paging--
#7 0x0000000000000000 in ?? ()
No symbol table info available.
Backtrace stopped: Cannot access memory at address 0x835349000Thread 2 (LWP 561146 of process 86533 "IM#01"):
#0 0x000000082f9457ea in _read () from /lib/libc.so.7
No symbol table info available.
#1 0x000000082b0bfa13 in ?? () from /lib/libthr.so.3
No symbol table info available.
#2 0x00000000006355ed in AlertPfMonitorIfaceChanges ()
No symbol table info available.
#3 0x000000082b0b3d25 in ?? () from /lib/libthr.so.3
No symbol table info available.
#4 0x0000000000000000 in ?? ()
No symbol table info available.
Backtrace stopped: Cannot access memory at address 0x83423d000Thread 1 (LWP 100234 of process 86533):
#0 0x000000082f9456ea in _nanosleep () from /lib/libc.so.7
No symbol table info available.
#1 0x000000082b0bf82c in ?? () from /lib/libthr.so.3
No symbol table info available.
#2 0x000000082f8c9c46 in usleep () from /lib/libc.so.7
No symbol table info available.
#3 0x000000000059fa6a in ?? ()
No symbol table info available.
#4 0x000000000059f3b4 in SuricataMain ()
No symbol table info available.
#5 0x000000082f89b6fa in __libc_start1 () from /lib/libc.so.7
No symbol table info available.
#6 0x000000000059bea0 in _start ()
No symbol table info available. - 10 LWP 561677 of process 86533 "W#07" 0x000000082f969454 in exit () from /lib/libc.so.7
-
@kiokoman said in Suricata process dying due to hyperscan problem:
LAN interfaces starts but then randomly crashes after a few minutes (max 5 min)
LAN interface stay up and running if i disable blocking mode
Hmm...okay, let's see how long the LAN stays up.
Next question is "what is different in terms of VLANs and things like the Pass List for the two interfaces?"
You said you cloned the LAN from the WAN, so I assume all the other settings are identical. The only changes would typically be the interface IP addresses and thus the composition of the resultant default Pass List.
Are both WAN and LAN using the defaults for $HOME_NET, $EXTERNAL_NET, and Pass List?
-
wan have no vlan
lan have 2 vlan 100 and 110yup WAN and LAN are using the defaults for $HOME_NET, $EXTERNAL_NET, and Pass List
-
@kiokoman said in Suricata process dying due to hyperscan problem:
wan have no vlan
lan have 2 vlan 100 and 110yup WAN and LAN are using the defaults for $HOME_NET, $EXTERNAL_NET, and Pass List
Thank you for the info and test results.
Maybe VLANs or no VLANs figures in ???
Also a bit weird that Legacy Blocking Mode off seems to help (at least thus far in your individual testing).
-
Delayed Detect Suricata will build list of signatures after packet capture threads have started. Default is Not Checked.
if checked, suricata crash immediately with Hyperscan returned fatal error -1.
now i'm trying without vlan and it's up and running for some times ....
i can't stay without vlan for too long max 10 min before they find out and sends some ninja to kill me
̿' ̿'\̵͇̿̿\з=(◕_◕)=ε/̵͇̿̿/'̿'̿ ̿
Please do not use chat/PM to ask for help
we must focus on silencing this @guest character. we must make up lies and alter the copyrights !
Don't forget to Upvote with the 👍 button for any post you find to be helpful. -
-
@kiokoman said in Suricata process dying due to hyperscan problem:
Delayed Detect Suricata will build list of signatures after packet capture threads have started. Default is Not Checked.
if checked, suricata crash immediately with Hyperscan returned fatal error -1.
now i'm trying without vlan and it's up and running for some times ....
i can't stay without vlan for too long max 10 min before they find out and sends some ninja to kill me
Thank you for that additional info. The only way I can see the Delayed Detect playing into it is maybe increased memory usage (but just a guess).
VLANs are one thing I did not test with in my small test environment. I run everything inside VMware Workstation and it does not support VLAN tagging.
-
For other users experiencing the Hyperscan crash in Suricata --
-
Do you have one or more VLANs configured on the interface that crashes?
-
Does disabling blocking mode on the crashing interface result in a difference in behavior?
If you have fiddled with the MPM Algorithm setting on the INTERFACE SETTINGS tab, be sure to return it to Auto and save the change before testing.
-
-
@bmeeks anecdotally, yes. ~8hrs after disabling blocking mode and both LAN PHY Suricata instances are still up.
-
@asdjklfjkdslfdsaklj said in Suricata process dying due to hyperscan problem:
@bmeeks anecdotally, yes. ~8hrs after disabling blocking mode and both LAN PHY Suricata instances are still up.
-
I need to know if you have any VLAN configured on either LAN interface.
-
Try enabling Blocking Mode on just one of the LAN interfaces and see what happens then.
To help me troubleshoot this, I desparately need you folks having the issue to give me some explicit details when responding. For example, answer question #1 above and also try troubleshooting suggestion #2 above. Then follow up back here with detailed results for each.
I will repeat again for clarity: I am trying to determine if VLANs configured on the crashing interface are related or not. So, tell me if you have VLANs on the interface, and if you do, how many. Then tell me if you can relate the crash to blocking enabled or not.
-