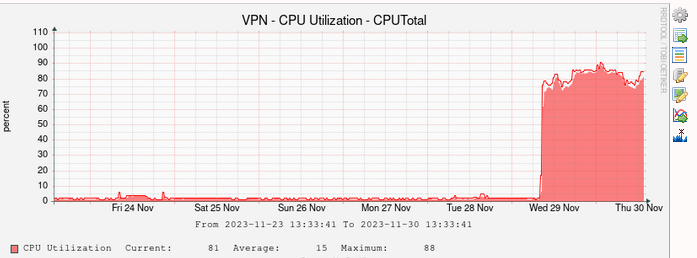
High CPU usage after upgrading to 2.7.1 Community Edition in XenServer
-
Yes. As an experiment, I rebooted the VM with 4 CPU's. This was the result:
last pid: 81307; load averages: 0.50, 0.27, 0.11 up 0+00:02:22 13:59:21
311 threads: 5 running, 279 sleeping, 27 waiting
CPU 0: 0.0% user, 0.0% nice, 0.0% system, 66.3% interrupt, 33.7% idle
CPU 1: 0.0% user, 0.0% nice, 0.0% system, 47.7% interrupt, 52.3% idle
CPU 2: 0.0% user, 0.0% nice, 0.0% system, 44.4% interrupt, 55.6% idle
CPU 3: 0.0% user, 0.0% nice, 0.0% system, 67.7% interrupt, 32.3% idle
Mem: 113M Active, 81M Inact, 259M Wired, 477M Free
ARC: 106M Total, 29M MFU, 73M MRU, 16K Anon, 601K Header, 3111K Other
80M Compressed, 179M Uncompressed, 2.24:1 Ratio
Swap: 1024M Total, 1024M FreePID USERNAME PRI NICE SIZE RES STATE C TIME WCPU COMMAND
11 root 187 ki31 0B 64K CPU2 2 2:10 99.83% [idle{idle: cpu2}]
11 root 187 ki31 0B 64K RUN 1 2:20 99.82% [idle{idle: cpu1}]
11 root 187 ki31 0B 64K CPU3 3 2:19 99.77% [idle{idle: cpu3}]
11 root 187 ki31 0B 64K CPU0 0 2:20 99.72% [idle{idle: cpu0}]
12 root -64 - 0B 368K WAIT 2 0:00 0.10% [intr{irq15: ata1}]
43244 root 20 0 14M 4236K CPU1 1 0:00 0.07% top -HaSP
12 root -64 - 0B 368K WAIT 2 0:00 0.06% [intr{irq2129: xbd0}]
2 root -60 - 0B 64K WAIT 0 0:00 0.06% [clock{clock (0)}]
0 root -12 - 0B 1536K - 1 0:00 0.06% [kernel{z_wr_iss_2}] -
Hmm, interesting. If you disable or uninstall the xe-guest-utilities does that usage stop?
-
@stephenw10
Unfortunately, no, it didn't help:
top -HaSPb
last pid: 85886; load averages: 0.07, 0.14, 0.07 up 0+00:04:15 08:27:14
309 threads: 5 running, 277 sleeping, 27 waiting
CPU 0: 3.3% user, 0.0% nice, 0.0% system, 54.1% interrupt, 42.6% idle
CPU 1: 4.0% user, 0.0% nice, 0.0% system, 44.0% interrupt, 52.0% idle
CPU 2: 4.2% user, 0.0% nice, 0.0% system, 47.4% interrupt, 48.4% idle
CPU 3: 4.0% user, 0.0% nice, 0.0% system, 42.5% interrupt, 53.5% idle
Mem: 112M Active, 81M Inact, 261M Wired, 476M Free
ARC: 107M Total, 29M MFU, 74M MRU, 160K Anon, 602K Header, 3220K Other
80M Compressed, 180M Uncompressed, 2.24:1 Ratio
Swap: 1024M Total, 1024M FreePID USERNAME PRI NICE SIZE RES STATE C TIME WCPU COMMAND
11 root 187 ki31 0B 64K RUN 1 4:14 100.00% [idle{idle: cpu1}]
11 root 187 ki31 0B 64K CPU0 0 4:13 100.00% [idle{idle: cpu0}]
11 root 187 ki31 0B 64K CPU3 3 4:12 100.00% [idle{idle: cpu3}]
11 root 187 ki31 0B 64K CPU2 2 4:01 100.00% [idle{idle: cpu2}]
0 root -16 - 0B 1536K swapin 3 0:46 0.00% [kernel{swapper}]
16 root -60 - 0B 80K - 1 0:02 0.00% [usb{usbus0}]
2 root -60 - 0B 64K WAIT 0 0:01 0.00% [clock{clock (0)}]To make sure it wasn't anything related to xen-guest, I also undid all the configurations related to installing this package (as in: disabling hardware offloading both via cli and web interface) and rebooted the VM, but the load, as shown above, remains high. Any suggestions?
Thank you,
DrydenK
-
Give it 4GB ram and 10GB disk... and reboot/reinstall.
-
@Cool_Corona
About reinstall, I will consider it.About 4GB and 10GB disk, that makes very little sense. As shown in the output of top, the VM is barely using half of the 1GB it has (476MB free and 0 usage of swap), and 'df' shows that it's using 37% of the 5GB of the disk.
-
@DrydenK-0 I cant give you good arguments. Odd things happen when memory and disk is low/small. Try it.
-
I tried reinstalling the VM from scratch and then reloading it with my setup. The result is still the same high load.
Since it was just a reload away, I tried increasing memory to 4GB (I had already used 10gb for disk). Still, no change as seen below.
Also, to isolate if it's something in my setup, I did a new install and checked top before setting anything. With pfSense still on the initial setup web page, I went to the command line and ran 'top -HaSP'. Even with nothing set, the result was still the same with a very high interrupt load.
Since no one else seems to be seeing this, my conclusion is that it may be something related to virtualization in Citrix-Xen.
top -HaSPb
last pid: 98295; load averages: 0.33, 0.17, 0.07 up 0+00:01:50 11:24:26
310 threads: 5 running, 278 sleeping, 27 waiting
CPU 0: 7.9% user, 0.1% nice, 0.0% system, 47.3% interrupt, 44.7% idle
CPU 1: 9.2% user, 0.0% nice, 0.0% system, 37.3% interrupt, 53.5% idle
CPU 2: 8.0% user, 0.0% nice, 0.0% system, 44.1% interrupt, 47.9% idle
CPU 3: 10.4% user, 0.0% nice, 0.0% system, 38.5% interrupt, 51.1% idle
Mem: 114M Active, 84M Inact, 236M Wired, 3478M Free
ARC: 109M Total, 20M MFU, 85M MRU, 158K Anon, 593K Header, 3260K Other
86M Compressed, 190M Uncompressed, 2.22:1 Ratio
Swap: 1024M Total, 1024M FreePID USERNAME PRI NICE SIZE RES STATE C TIME WCPU COMMAND
11 root 187 ki31 0B 64K CPU1 1 1:48 100.00% [idle{idle: cpu1}]
11 root 187 ki31 0B 64K CPU0 0 1:49 98.97% [idle{idle: cpu0}]
11 root 187 ki31 0B 64K RUN 3 1:45 98.97% [idle{idle: cpu3}]
11 root 187 ki31 0B 64K CPU2 2 1:36 98.97% [idle{idle: cpu2}]
0 root -16 - 0B 1536K swapin 3 0:44 0.00% [kernel{swapper}] -
@DrydenK-0 said in High CPU usage after upgrading to 2.7.1 Community Edition:
it may be something related to virtualization in Citrix-Xen.
Yes that seems likely. Do you see this on a clean install of a new VM with something close to the default config?
-
VERY default. As I said, i went to the console with pfSense still in the initial setup page, so no setting made at all.
-
 S stephenw10 moved this topic from General pfSense Questions on
-
We can also confirm that we are observing the same behavior after the upgrade to 2.7.1.
Running XenServer as well (8.2.1)
top -HaSPb
last pid: 23570; load averages: 0.24, 0.25, 0.17 up 0+13:10:50 00:03:38
239 threads: 5 running, 187 sleeping, 47 waiting
CPU 0: 0.1% user, 0.1% nice, 0.0% system, 17.9% interrupt, 81.9% idle
CPU 1: 0.1% user, 0.1% nice, 0.0% system, 12.6% interrupt, 87.3% idle
CPU 2: 0.1% user, 0.1% nice, 0.0% system, 13.3% interrupt, 86.5% idle
CPU 3: 0.1% user, 0.1% nice, 0.0% system, 13.4% interrupt, 86.4% idle
Mem: 94M Active, 220M Inact, 315M Wired, 124M Buf, 5284M Free
Swap: 1024M Total, 1024M FreeWe can confirm that the interrupts are not showing up on the host server. The high interrupt is only reflected in the VM.
-
But you do see CPU usage like OP shows in the first post?
-
What do you see causing the interrupt load in
vmstat -i? -
]/root: vmstat -i interrupt total rate irq1: atkbd0 2 0 irq15: ata1 111765 1 irq23: uhci0 16 0 cpu0:xen 10385530 61 cpu1:xen 8100717 48 cpu2:xen 7320906 43 cpu3:xen 7430090 44 irq2096: cpu0:r 1031 0 irq2097: cpu0:itlb 236290 1 irq2098: cpu0:b 4252302 25 irq2102: cpu1:r 1309 0 irq2103: cpu1:itlb 235826 1 irq2104: cpu1:b 4563379 27 irq2108: cpu2:r 373 0 irq2109: cpu2:itlb 234740 1 irq2110: cpu2:b 4808132 28 irq2114: cpu3:r 224 0 irq2115: cpu3:itlb 235961 1 irq2116: cpu3:b 4736445 28 irq2120: xen_et0:c0 2678328 16 irq2121: xen_et0:c1 1831505 11 irq2122: xen_et0:c2 1881594 11 irq2123: xen_et0:c3 1869526 11 irq2124: xenstore0 824 0 irq2129: xbd0 2762175 16 irq2130: xn0 507745 3 irq2131: xn0 609115 4 irq2132: xn0 418078 2 irq2133: xn0 1492607 9 Total 66706535 392 -
Hmm, nothing that would normally worry me....

-
This is vmstat -i for us:
vmstat -i
interrupt total rate irq1: atkbd0 2 0 irq15: ata1 73032 1 irq23: uhci0 16 0 cpu0:xen 38060450 345 cpu1:xen 39683377 359 cpu2:xen 35947584 325 cpu3:xen 35061579 317 irq2096: cpu0:r 1627 0 irq2097: cpu0:itlb 379625 3 irq2098: cpu0:b 12717262 115 irq2102: cpu1:r 2726 0 irq2103: cpu1:itlb 375826 3 irq2104: cpu1:b 12093642 109 irq2108: cpu2:r 1270 0 irq2109: cpu2:itlb 373779 3 irq2110: cpu2:b 13025219 118 irq2114: cpu3:r 1244 0 irq2115: cpu3:itlb 373885 3 irq2116: cpu3:b 12454464 113 irq2120: xen_et0:c0 1486542 13 irq2121: xen_et0:c1 1224535 11 irq2122: xen_et0:c2 1217963 11 irq2123: xen_et0:c3 1213515 11 irq2124: xenstore0 20877 0 irq2129: xbd0 83349 1 irq2130: xn0 11538967 104 irq2131: xn0 8785273 80 irq2132: xn0 13063677 118 irq2133: xn0 16360612 148 irq2134: xn1 8424918 76 irq2135: xn1 7869522 71 irq2136: xn1 6623171 60 irq2137: xn1 7929750 72 irq2138: xn2 1668062 15 irq2139: xn2 1563326 14 irq2140: xn2 1591044 14 irq2141: xn2 1444504 13 irq2142: xn3 1827567 17 irq2143: xn3 2453480 22 irq2144: xn3 29 0 irq2145: xn3 232 0 irq2146: xn4 579364 5 irq2147: xn4 794470 7 irq2148: xn4 514168 5 irq2149: xn4 970528 9 irq2150: xn5 57959 1 irq2151: xn5 53901 0 irq2152: xn5 61069 1 irq2153: xn5 151422 1 Total 300200405 2718 -
There is already a discussion on this topic here https://forum.netgate.com/topic/184245/high-interrupt-cpu-usage-in-v2-7-1/7
After upgrading to 2.7.2 nothing has changed. The problem only appears on Xen, on ESXi everything is fine. -
@sknigen said in High CPU usage after upgrading to 2.7.1 Community Edition in XenServer:
https://forum.netgate.com/topic/184245/high-interrupt-cpu-usage-in-v2-7-1/7
Ah, better to use that thread going forward then.