Alert rule triggering Drop rule?


-
@Gblenn: search for the SID in the active rules file and let's see what the real action verb is set for. Do that as follows:
-
Open a shell prompt on the firewall console either directly (if you have physical access) or via an SSH login from an available client PC (probably easier and what I would suggest).
-
Navigate to the interface's active rules file at
/usr/local/etc/suricata/suricata_xxxx/rules/suricata.rules(wheresuricata_xxxxis a directory name containing the physical interface descriptor along with a UUID). -
Search the active rules file for the target SID as follows:
grep 2021076 suricata.rulesThat should print out the line from the file containg that rule and you can examine the actual action verb Suricata is loading for the rule.
-
-
@bmeeks Thanks, here's what it looks like, and it's set to alert:
alert http $EXTERNAL_NET any -> $HOME_NET any (msg:"ET HUNTING SUSPICIOUS Dotted Quad Host MZ Response"; flow:established,to_client; flowbits:isset,http.dottedquadhost; file_data; content:"MZ"; within:2; content:"PE|00 00|"; distance:0; classtype:bad-unknown; sid:2021076; rev:2; metadata:created_at 2015_05_08, former_category INFO, updated_at 2015_05_08;)
The other rule is as expected set to drop...
drop http $EXTERNAL_NET any -> $HOME_NET any (msg:"ET POLICY PE EXE or DLL Windows file download HTTP"; flow:established,to_client; flowbits:isnotset,ET.http.binary; flowbits:isnotset,ET.INFO.WindowsUpdate; file_data; content:"MZ"; within:2; byte_jump:4,58,relative,little; content:"PE|00 00|"; distance:-64; within:4; flowbits:set,ET.http.binary; classtype:policy-violation; sid:2018959; rev:4; metadata:created_at 2014_08_19, former_category POLICY, updated_at 2017_02_01;)
-
@Gblenn said in Alert rule triggering Drop rule?:
@bmeeks Thanks, here's what it looks like, and it's set to alert:
alert http $EXTERNAL_NET any -> $HOME_NET any (msg:"ET HUNTING SUSPICIOUS Dotted Quad Host MZ Response"; flow:established,to_client; flowbits:isset,http.dottedquadhost; file_data; content:"MZ"; within:2; content:"PE|00 00|"; distance:0; classtype:bad-unknown; sid:2021076; rev:2; metadata:created_at 2015_05_08, former_category INFO, updated_at 2015_05_08;)
The other rule is as expected set to drop...
drop http $EXTERNAL_NET any -> $HOME_NET any (msg:"ET POLICY PE EXE or DLL Windows file download HTTP"; flow:established,to_client; flowbits:isnotset,ET.http.binary; flowbits:isnotset,ET.INFO.WindowsUpdate; file_data; content:"MZ"; within:2; byte_jump:4,58,relative,little; content:"PE|00 00|"; distance:-64; within:4; flowbits:set,ET.http.binary; classtype:policy-violation; sid:2018959; rev:4; metadata:created_at 2014_08_19, former_category POLICY, updated_at 2017_02_01;)
Have you restarted Suricata on this interface since changing the rule action?
Also I'm not clear if you changed the rule action using the icons on the ALERTS tab or if you are doing everything solely through SID MGMT tab features.
The custom blocking module code explicitly checks an internal flag set by the Suricata binary before proceeding with a block. Here is the pertinent code section:
/* Don't block on alerts where SIG_FLAG_NOALERT is set for the Signature */
if (pa->s->flags & SIG_FLAG_NOALERT) {
    continue;
}
SC_ATOMIC_ADD(alert_pf_alerts, 1);

 /* If blocking only DROP rules and alert is not from a DROP rule, ignore it */
if (apft->ctx->block_drops && !(PacketCheckAction(p, ACTION_DROP))) {
    continue;
}
The "continue;" statement above means when the checked condition is true the loop continues to process the next alert from the packet (in case multiple rules triggered on a given packet). But it skips the blocking stuff.
-
@bmeeks About three weeks ago I did some testing with Inline mode but wasn't getting the performance I wanted. So I quickly changed back to legacy mode although this time I set it to Block on Drop Only.
I then started using SID Mgmt and added most of the Emerging Threats rules lists to the drop.conf list.
There were two lists which I did NOT change however, and these were ET INFO and ET HUNTING, which is where these alert rules are found.
I did at one point set all of the ET lists to Drop, when I was still figuring out how SID Mgmt worked... But since then I made a couple of restarts of Suricata as well as pfsense. In addition I did a complete shut down 5 days ago, as well as restarting Suricata 2 days ago... and again just now while writing this.
I use SID Mgmt to Disable QUIC and STREAM lists and a number of individual listings I previously had in the Suppress list, prior to changing to Block on Drop Only.
After having this issue I put sid:2018959 in the Suppress list using the GUI. Meaning I pressed the plus sign in the GID:SID column...
So in the picture above, 2021076 has Alert action and 2018959 is suppressed, yet both show up in the Blocks tab (and block.log).
Greping for any of the rules I currently have in the Suppress list, gives me a result consistent with what I listed above. Meaning I see the info including the expected action Drop or Alert.
Greping for rules which are in the SID Mgmt Disable.conf list, gives me empty result, (not present in suricata.rules).
Yet, none of the other rules which are in the suppress list have generated an Alert or a Block since a week back, or more. And I know at least a few of them would have, since they are related to my sons PC which would trigger both Discord and Minecraft related rules.
-
Was doing some maintenance today and made a complete shutdown of the machine. Nothing seems to have changed though, still having rules with Alert action triggering blocks...

-
@Gblenn said in Alert rule triggering Drop rule?:
Was doing some maintenance today and made a complete shutdown of the machine. Nothing seems to have changed though, still having rules with Alert action triggering blocks...
The only possibilty I know of is that internally the Suricata binary is tagging that packet with DROP for some other reason. If you are running an EVE JSON logging configuration, you can search through the EVE JSON log to find any entries related to that SID. EVE provides detailed logging information including "drop reason". A packet might have been marked as "drop" because it matches a closed flow or triggered some other internal Suricata consistency check.
The custom blocking module is not looking at the actual triggered rule's text when determining if a packet should be dropped. It is instead looking for a flag set in a memory structure of alerts related to that rule (SID). There are other reason's why Suricata's internal engine might set that drop flag. Those should be logged in the matching EVE JSON entry.
Here is a list from the Suricata source of the various reasons a packet might get marked with the "drop" flag: https://github.com/OISF/suricata/blob/13cc49388523ba19d3b5b1e72063ca7f0f444be6/src/decode.c#L827. These reasons should be logged in the EVE JSON log when you find the matching alert entry there.
-
@bmeeks Quite a lot of "stuff" in those files... not 100% sure what to look for except (block, alert, action etc?)
Anyway, first off I see this in the block.log (same SID as before):

And in the Alerts tab I have this with the same time stamp:

And here's from the eve.json file, where I find what I think is the start of what is related to this rule (2021076)? And I believe it ends with ..."bytes 0-1048575/2426344"}]}}
After the first bit of readable info, there's a lot of garbled info, or binary i guess, and possibly hash data, mixed in with text. I think I have figured out that this is actually a MS download of AV data?
But from what I can see it looks like action:allowed ??
{"timestamp":"2023-12-06T14:59:47.731754+0100","flow_id":2024081892321530,"in_iface":"ix1",
"event_type":"alert","src_ip":"151.139.183.24","src_port":80,"dest_ip":"192.168.1.92","dest_port":55069,"proto":"TCP","pkt_src":"wire/pcap","metadata":{"flowbits":["exe.no.referer","http.dottedquadhost","file.exe","ET.http.binary"]},"tx_id":1,"alert":{"action":"allowed","gid":1,"signature_id":2021076,"rev":2,"signature":"ET HUNTING SUSPICIOUS Dotted Quad Host MZ Response","category":"Potentially Bad Traffic","severity":2,"metadata":{"created_at":["2015_05_08"],"former_category":["INFO"],"updated_at":["2015_05_08"]}},"http":{"hostname":"151.139.183.24","url":"/c/msdownload/update/software/defu/2023/12/am_base_patch1_46a562cb0306caf4167e4ca4cf496900c24dd090.exe?cacheHostOrigin=11.au.download.windowsupdate.com","http_user_agent":"Microsoft-Delivery-Optimization/10.0","http_content_type":"application/octet-stream","content_range":{"raw":"bytes 0-1048575/2426344","start":0,"end":1048575,"size":2426344},"http_method":"GET","protocol":"HTTP/1.1","status":206,"length":14052,"http_response_body_printable":"MZ...........@...............................................!..L.!This program cannot be run in DOS mode.\r\r\n......It then goes on with a lot of unintelligible data and something I think I have identified as a MS AV signature download based on text in the middle of all the data: /c/msdownload/update/software/defu/2023/12/am_base_patch1
Not sure what this is though?? It sais mode=block, but could that be info the MS AV??
"payload_printable":"HTTP/1.1 206 Partial Content\r\nServer: nginx\r\nDate: Wed, 06 Dec 2023 13:59:21 GMT\r\nContent-Type: application/octet-stream\r\nContent-Length: 2\r\nConnection: keep-alive\r\nCache-Control: public,max-age=172800\r\nLast-Modified: Tue, 05 Dec 2023 23:30:43 GMT\r\nX-Powered-By: ASP.NET\r\nX-CID: 10003\r\nX-CCC: b16aeb46-c642-459e-b5ae-4d702fbef56e\r\nContent-Security-Policy: default-src 'self' http: https: data: blob: 'unsafe-inline'\r\nX-XSS-Protection: 1; mode=block\r\nX-Frame-Options: SAMEORIGIN\r\nX-Cache-Status: HIT\r\nContent-Range: bytes 0-1/2426344\r\n\r\nMZHTTP/1.1 206 Partial Content\r\nServer: nginx\r\nDate: Wed, 06 Dec 2023 13:59:21 GMT\r\nContent-Type: application/octet-stream\r\nContent-Length: 1048576\r\nConnection: keep-alive\r\nCache-Control: public,max-age=172800\r\nLast-Modified: Tue, 05 Dec 2023 23:30:43 GMT\r\nX-Powered-By: ASP.NET\r\nX-CID: 10003\r\nX-CCC: b16aeb46-c642-459e-b5ae-4d702fbef56e\r\nContent-Security-Policy: default-src 'self' http: https: data: blob: 'unsafe-inline'\r\nX-XSS-Protection: 1; mode=block\r\nX-Frame-Options: SAMEORIGIN\r\nX-Cache-Status: HIT\r\nContent-Range:
-
@Gblenn: here is a link to the official upstream Suricata documentation describing all the EVE JSON logging fields: https://docs.suricata.io/en/latest/output/eve/eve-json-format.html.
Scroll down that page and read the section titled Verdict. My suspicion in your example is that Verdict is being set to "drop" by one of the other criteria listed in the C source code snippet I provided a link to earlier. Suricata can flag a packet to be dropped (by giving a Verdict of "drop") for reasons besides just the rule action keyword.
This is a popular and often-used tool to query JSON logs. I'm not sure it's available for pfSense directly (probably not), but you can download versions for several platforms here: https://jqlang.github.io/jq/download/. You could install
jqon your Windows PC, transfer the EVE JSON logs over using WinSCP, then search and analyze them usingjqto see if my suspicion is correct. -
@bmeeks Thanks a lot for helping me trying to figure this out!!
I have been using an editor to read the .json files and searching for anything I thought could be relevant, like "drop", "alert", "action", "block" etc. It works fine I think, although it doesn't present each event on single rows...
I wonder if there are things I'm not logging still? I can find most or all the different things like event types, action etc.
However, there is nothing in any of my eve.json files relating to what is stated about Verdict (that word does not appear at all, but perhaps it shouldn't?). Neither do the words "drop", "reject" or "reject_target"... nothing...When I search for the IP related to the rule in question, (151.139.183.24) it does show up quite a number of times, starting about 12 seconds before sid 2021076 appears.
I have 7 of these instanses before the blocking occurs, but only two have the same flow id. These two are event_type http and file_info (all of them are in fact).
{"timestamp":"2023-12-06T14:59:47.672461+0100","flow_id":2024081892321530,"in_iface":"ix1","event_type":"fileinfo","src_ip":"151.139.183.24","src_port":80,"dest_ip":"192.168.1.92","dest_port":55069,"proto":"TCP","pkt_src":"wire/pcap","metadata":{"flowbits":["exe.no.referer","http.dottedquadhost","file.exe"]},"http":{"hostname":"151.139.183.24","url":"/c/msdownload/update/software/defu/2023/12/am_base_patch1_46a562cb0306caf4167e4ca4cf496900c24dd090.exe?cacheHostOrigin=11.au.download.windowsupdate.com","http_user_agent":"Microsoft-Delivery-Optimization/10.0","http_content_type":"application/octet-stream","content_range":{"raw":"bytes 0-1/2426344","start":0,"end":1,"size":2426344},"http_method":"GET","protocol":"HTTP/1.1","status":206,"length":2},"app_proto":"http","fileinfo":{"filename":"/c/msdownload/update/software/defu/2023/12/am_base_patch1_46a562cb0306caf4167e4ca4cf496900c24dd090.exe","gaps":false,"state":"CLOSED","stored":false,"size":2,"start":0,"end":1,"tx_id":0}}
Nothing here to indicate this has been evaluated and given any "verdict"?? The following item is the one I pasted above: {"timestamp":"2023-12-06T14:59:47.731754 and so on...
And the only reference to some "action" or evaluation is what you see in bold here, plus those two mode=block I mentioned which I think are not related to suricata?
"alert":{"action":"allowed","gid":1,"signature_id":2021076,"rev":2,"signature":"ET HUNTING SUSPICIOUS Dotted Quad Host MZ Response"
What makes me curious is that greping ALL 7 days worth of eve.json files for "action":"blocked" gives me nothing...
There isn't even one single event with block action in any of those files. To verify I tried greping individual SID's which I know should, and also do generate blocking, as they are set to Drop.Below is the output from greping one sid that doesn't occur too often:
'find /var/log/suricata/suricata_ix128603 -type f -name 'eve.json.' -exec grep '2403379' {} +'*/var/log/suricata/suricata_ix128603/eve.json.2023_1202_0850:{"timestamp":"2023-12-02T08:42:07.457953+0100","flow_id":2248369872475030,"in_iface":"ix1","event_type":"alert","src_ip":"71.6.199.23","src_port":17340,"dest_ip":"192.168.1.18","dest_port":80,"proto":"TCP","pkt_src":"wire/pcap","alert":{"action":"allowed","gid":1,"signature_id":2403379,"rev":87975,"signature":"ET CINS Active Threat Intelligence Poor Reputation IP group 80","category":"Misc Attack","severity":2,"metadata":{"affected_product":["Any"],"attack_target":["Any"],"created_at":["2013_10_08"],"deployment":["Perimeter"],"signature_severity":["Major"],"tag":["CINS"],"updated_at":["2023_12_01"]}},"direction":"to_server","flow":{"pkts_toserver":1,"pkts_toclient":0,"bytes_toserver":58,"bytes_toclient":0,"start":"2023-12-02T08:42:07.457953+0100","src_ip":"71.6.199.23","dest_ip":"192.168.1.18","src_port":17340,"dest_port":80},"payload_printable":"","stream":0,"packet":"prhwJhx8kBsObbeFCABFAAAsCv8AAGMGfPVHBscXwKgBEkO8AFC1fPCEAAAAAGAClb9IgQAAAgQFtA==","packet_info":{"linktype":1}}
/var/log/suricata/suricata_ix128603/eve.json.2023_1130_1700:{"timestamp":"2023-11-30T16:45:15.264026+0100","flow_id":852509610708298,"in_iface":"ix1","event_type":"alert","src_ip":"80.120.241.118","src_port":8080,"dest_ip":"192.168.1.29","dest_port":6881,"proto":"UDP","pkt_src":"wire/pcap","alert":{"action":"allowed","gid":1,"signature_id":2403379,"rev":87927,"signature":"ET CINS Active Threat Intelligence Poor Reputation IP group 80","category":"Misc Attack","severity":2,"metadata":{"affected_product":["Any"],"attack_target":["Any"],"created_at":["2013_10_08"],"deployment":["Perimeter"],"signature_severity":["Major"],"tag":["CINS"],"updated_at":["2023_11_29"]}},"app_proto":"failed","direction":"to_server","flow":{"pkts_toserver":1,"pkts_toclient":0,"bytes_toserver":55,"bytes_toclient":0,"start":"2023-11-30T16:45:15.264026+0100","src_ip":"80.120.241.118","dest_ip":"192.168.1.29","src_port":8080,"dest_port":6881},"payload":"XC5jcVg4VH1vZA4IVQ==","payload_printable":"\.cqX8T}od..U","stream":0,"packet":"yqgP9d0gkBsObbeFCABFAAApOkxAADIRCsRQePF2wKgBHR+QGuEAFYLcXC5jcVg4VH1vZA4IVQ==","packet_info":{"linktype":1}}
-
@Gblenn: you may not have that option enabled. It's relatively new in Suricata.
Look for Engine Verdict in the EVE Output Settings section of the INTERFACES EDIT tab. See if that option is enabled. If not, enable it, save the change, and restart Suricata on the interface so the binary picks up the change.
-
-
Found this as well... checked that one as well...

-
@Gblenn said in Alert rule triggering Drop rule?:
Found this as well... checked that one as well...
Yes, that one along with the previous one should result in the final engine verdict being logged in the EVE JSON log. Hopefully that will show why that particular rule is resulting in the alert packet being flagged with DROP.
-
@bmeeks Ok thanks, I guess I'll have to wait a bit then to have some more data to look into..
-
@Gblenn Do I need to restart Suricata for this take effect, or is Save enough?
-
@Gblenn said in Alert rule triggering Drop rule?:
@Gblenn Do I need to restart Suricata for this take effect, or is Save enough?
You must always restart Suricata when making any configuration change. That's because what you are doing in the GUI is simply writing updated info to the text-based
suricata.yamlconf file for the running binary. That binary piece only reads the conf file at startup. No configuration changes are sensed after the binary has started.I will repeat this for the benefit of others in the future who might stumble upon this thread:
The Suricata package contains two related but completely different components. There is a GUI wrapper written in PHP that creates and displays the pretty web-based screens you tab around in and make configuration selections. That code has zero to do with scanning traffic, though. All of that is performed by the binary daemon that runs in the background. That daemon reads all of its configuration information from a text-based
suricata.yamlfile created individually for each configured interface by the GUI code.Suricata is distributed by upstream as just a plain-vanilla binary executable that relies upon a manually configured text conf file. That file has to be created by the user via the CLI (command line interface). On pfSense I made that process much friendlier by creating the PHP wrapper GUI. The user then can use the GUI to make various configuration selections. The chosen parameters are then written to the text-based conf file the Suricata binary piece expects. If you install Suricata on any other platform (Linux, Windows, or FreeBSD), you would have to configure everything by hand using the CLI. The pfSense package makes life easier by wrapping that hand-editing with a GUI.
-
@bmeeks Ok, restarted Suricata about 5 hours ago, and now the logs show Verdict as well...
BUT, I don't understand, there is still no Drop or Blocked action anywhere...
Here's an example of something that should generate a blocking:
Fist in the Rule category listing, it's clearly set to DROP

And here it is showing up as expected in the Blocked Hosts tab:
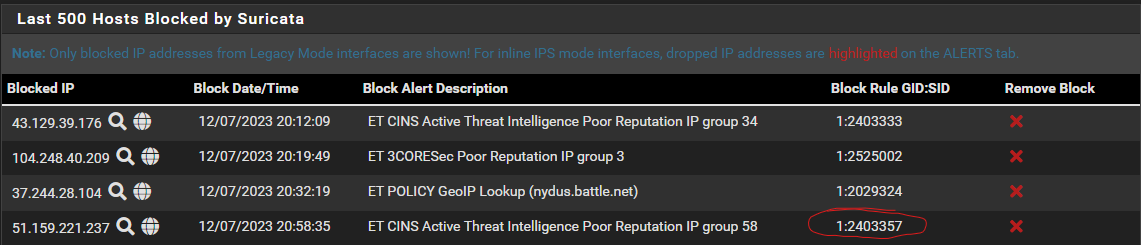
As well as the Alerts tab:

But, looking at the eve.json file, it is still only alert: In fact, greping all the eve.json files again for "action":"blocked" , "drop" or anything other than alert gives me nothing...
{"timestamp":"2023-12-07T20:58:35.473754+0100","flow_id":908861034418160,"in_iface":"ix1","event_type":"alert","src_ip":"51.159.221.237","src_port":30301,"dest_ip":"192.168.1.29","dest_port":6881,"proto":"UDP","pkt_src":"wire/pcap","alert":{"action":"allowed","gid":1,"signature_id":2403357,"rev":88095,"signature":"ET CINS Active Threat Intelligence Poor Reputation IP group 58","category":"Misc Attack","severity":2,"metadata":{"affected_product":["Any"],"attack_target":["Any"],"created_at":["2013_10_08"],"deployment":["Perimeter"],"signature_severity":["Major"],"tag":["CINS"],"updated_at":["2023_12_06"]}},"app_proto":"failed","direction":"to_server","flow":{"pkts_toserver":1,"pkts_toclient":0,"bytes_toserver":116,"bytes_toclient":0,"start":"2023-12-07T20:58:35.473754+0100","src_ip":"51.159.221.237","dest_ip":"192.168.1.29","src_port":30301,"dest_port":6881},"payload":"Gy5ebWtMekYNAQMkZ2dpTT1UHzVhKygmSU9xQzxnZldfRERKED8QHUATQSh6KnU4fxVtYEAVBglleEwhXzJ5PnY9CAd8GCQ93nE=","payload_printable":"..^mkLzF\r..$ggiM=T.5a+(&IOqC<gfW_DDJ.?..@.A(z*u8..m`@...exL!_2y>v=..|.$=.q","stream":0,"packet":"yqgP9d0gkBsObbeFCABFAABmci1AADERBAgzn93twKgBHXZdGuEAUilRGy5ebWtMekYNAQMkZ2dpTT1UHzVhKygmSU9xQzxnZldfRERKED8QHUATQSh6KnU4fxVtYEAVBglleEwhXzJ5PnY9CAd8GCQ93nE=","packet_info":{"linktype":1},"verdict":{"action":"alert"}}
-
@Gblenn: Sorry, but I misled you about the
verdict: dropEVE log entry. That only gets logged when Suricata is running with Inline IPS Mode. That will not get logged with "drop" when running with Legacy Blocking Mode.I just finished a complete test of the suppression and blocking logic on a virtual machine, and I could not replicate your problem. Everything worked exactly as designed.
I used a Kali Linux VM to target the WAN port of a pfSense firewall VM running Suricata on the WAN. I have a ton of rules loaded for testing, but one set I frequently use for general testing is the Emerging Threats Scan rules. Those will reliably alert with a number of the rules triggering for MS-SQL, VNC, and other targeted
nmapscans.I configured Legacy Blocking Mode, turned on the "Block on DROP Only" option, saved the change and restarted Suricata on the interface.
I scanned the pfSense firewall VM from the Kali Linux VM. I immediately received a flood of alerts as expected. But no blocks were logged and no IP addresses were added to the
snort2cblock table because none of my rules were set to DROP. This was as expected.Next, I changed my SID MGMT
dropsid.conffile to include the "emerging-scan" rules, saved that change and checked the box to rebuild the rules on the interface and send Suricata a live rules update signal.I then scanned the firewall again from the Kali Linux machine. This time I received both alerts and blocks as expected.
Finally, I tested alert suppression by adding rule SID 2010936 by clicking the icon on the ALERTS tab. Here is the automatic Suppress List entry:
#ET SCAN Suspicious inbound to Oracle SQL port 1521
suppress gen_id 1, sig_id 2010936
I then cleared all the blocks and alerts and repeated the Kali Linux scan of the pfSense machine. This time, I received alerts from all the same rules EXCEPT for SID 2010936 (because it was suppressed). There were no alerts from that SID and no blocks entered from it either.
This proves to me that the code logic is all working as designed. I tested all the possible scenarios.
-
@bmeeks said in Alert rule triggering Drop rule?:
Sorry, but I misled you about the verdict: drop EVE log entry. That only gets logged when Suricata is running with Inline IPS Mode. That will not get logged with "drop" when running with Legacy Blocking Mode.
No worries, I'm learning a lot and looking around in the eve.json files actually helped me figure out and remove a SMTP server on my sons PC, which had made my IP end up on Spamhaus bad rep list...
But I suppose this means that I might as well uncheck both those options as they will just add "noise" to the log file?
Your test seems conclusive and unless you have more ideas of where to look now, I'm thinking I should remove Suricata without keeping settings and reinstall fresh...? Even though I much rather figure this out...
-
Well, that didn't seem to help...
Removed Suricata completely, including log files. Restarted pfSense and installed Suricata fresh, and manually set it up as before.
But I still have this ET HUNTING rule popping up in the Blocks list.


It is set to Alert in the LAN Rule list, as are all ET HUNTING rules.

And this time I have no other references to the IP in question, other than two bits which look like the sections pasted below (with their own flow_id's).
"timestamp":"2023-12-08T14:02:46.056039+0100","flow_id":1537635578019863,"in_iface":"ix1","event_type":"http","src_ip":"192.168.1.92","src_port":51258,"dest_ip":"151.139.183.35","dest_port":80,"proto":"TCP","pkt_src":"wire/pcap","metadata":{"flowbits":["exe.no.referer","http.dottedquadhost"]},"tx_id":0,"http":{"hostname":"151.139.183.35","url":"/phf/c/doc/ph/prod5/msdownload/update/software/defu/2023/12/1024/am_delta_patch_1.403.87.0_82758fb46774249a30af8ffde579e044f936a35d.exe.json?cacheHostOrigin=download.windowsupdate.com","http_user_agent":"Microsoft-Delivery-Optimization/10.0","http_content_type":"application/json","http_method":"GET","protocol":"HTTP/1.1","status":200,"length":314,"request_headers":[{"name":"Connection","value":"Keep-Alive"},{"name":"Accept","value":"/"},{"name":"Accept-Encoding","value":"gzip, deflate"},{"name":"Content-Length","value":"0"}],"response_headers":[{"name":"Server","value":"nginx"},{"name":"Date","value":"Fri, 08 Dec 2023 13:02:39 GMT"},{"name":"Content-Type","value":"application/json"},{"name":"Content-Length","value":"314"},{"name":"Connection","value":"keep-alive"},{"name":"Cache-Control","value":"public,max-age=172800"},{"name":"Last-Modified","value":"Fri, 08 Dec 2023 09:47:20 GMT"}]}}
{"timestamp":"2023-12-08T14:02:46.602891+0100","flow_id":1948140415701057,"in_iface":"ix1","event_type":"fileinfo","src_ip":"151.139.183.35","src_port":80,"dest_ip":"192.168.1.92","dest_port":51260,"proto":"TCP","pkt_src":"wire/pcap","metadata":{"flowbits":["exe.no.referer","http.dottedquadhost","file.exe"]},"http":{"hostname":"151.139.183.35","url":"/c/msdownload/update/software/defu/2023/12/am_delta_patch_1.403.87.0_82758fb46774249a30af8ffde579e044f936a35d.exe?cacheHostOrigin=2.au.download.windowsupdate.com","http_user_agent":"Microsoft-Delivery-Optimization/10.0","http_content_type":"application/octet-stream","content_range":{"raw":"bytes 1048576-2094583/2094584","start":1048576,"end":2094583,"size":2094584},"http_method":"GET","protocol":"HTTP/1.1","status":206,"length":14046},"app_proto":"http","fileinfo":{"filename":"/c/msdownload/update/software/defu/2023/12/am_delta_patch_1.403.87.0_82758fb46774249a30af8ffde579e044f936a35d.exe","gaps":false,"state":"TRUNCATED","stored":false,"size":4096,"start":1048576,"end":2094583,"tx_id":0}}
And right after this one, there's the item where the rule is referenced:
{"timestamp":"2023-12-08T14:02:46.532735+0100","flow_id":1944640427955395,"in_iface":"ix1","event_type":"alert","src_ip":"151.139.183.35","src_port":80,"dest_ip":"192.168.1.92","dest_port":51259,"proto":"TCP","pkt_src":"wire/pcap","metadata":{"flowbits":["exe.no.referer","http.dottedquadhost","file.exe","ET.http.binary"]},"tx_id":1,"alert":{"action":"allowed","gid":1,"signature_id":2021076,"rev":2,"signature":"ET HUNTING SUSPICIOUS Dotted Quad Host MZ Response","category":"Potentially Bad Traffic","severity":2,"metadata":{"created_at":["2015_05_08"],"former_category":["INFO"],"updated_at":["2015_05_08"]}},"http":{"hostname":"151.139.183.35","url":"/c/msdownload/update/software/defu/2023/12/am_delta_patch_1.403.87
