Dashboard Traffic Graph VPN
-
Running on 2100 (edit: 24.03-RELEASE (arm64))
OpenVPN is setup and clients connect.
The ovpns1 network port has been assigned to OPT1 which was then renamed to VPNSThe rule has been placed under the VPNS tab and is showing states - Seems fine.
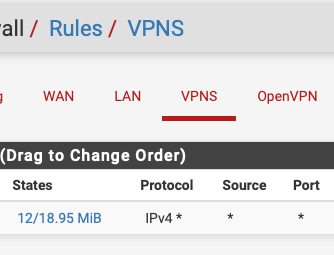
The interface is showing traffic - all fine
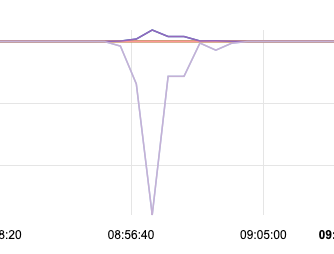
the monitoring traffic graphs show the traffic on both VPNS and "OpenVPN Server: XXXXXX" they are exactly the same - and appear "normal"
The dashboard widget offers the VPNS graph in addition to WAN and LAN (in fact VPNS added and selected by I assume the process of adding the port assignment)
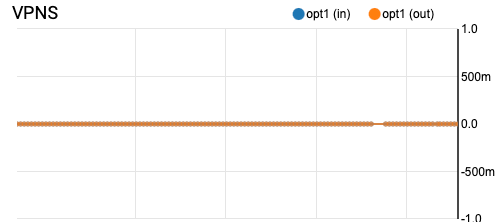
Issue is it never shows traffic here -
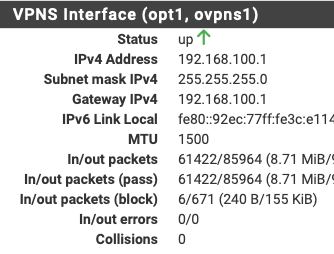
Seems to know it is opt1:
OpenVPN service was restarted after the interface assignment.
After the service restarted the "GATEWAY" shows as "Online" prior to restarting it was "pending"Something I've perhaps missed or just a widget bug?
-
@jrey said in Dashboard Traffic Graph VPN:
Something I've perhaps missed
Whatever it is, I miss it also.
"monitoring traffic graphs show the traffic" = for me also.
But nothing on real time Traffic Grapher. None of these two :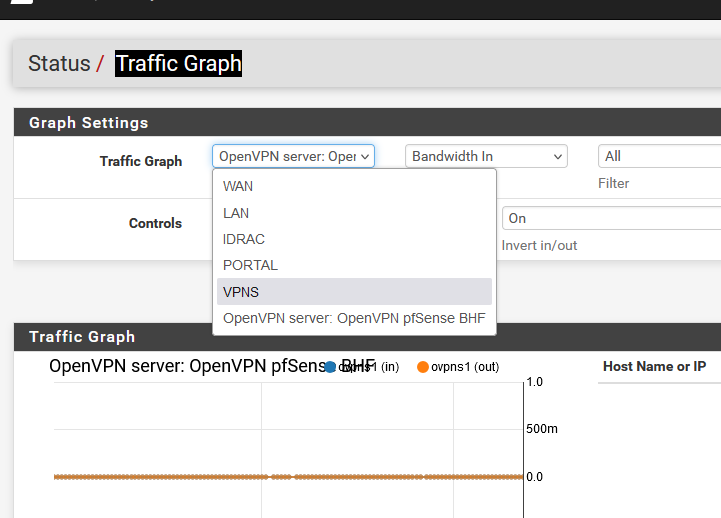
My VPNS or OpenVPN interface.
Its a flat liner. -
@Gertjan said in Dashboard Traffic Graph VPN:
Whatever it is, I miss it also.
Thanks - sounds like it is a dashboard widget bug then.
-
hey there,
same here, it seems...
what works:-
status / traffic graphs shows traffic on my openvpn interface:
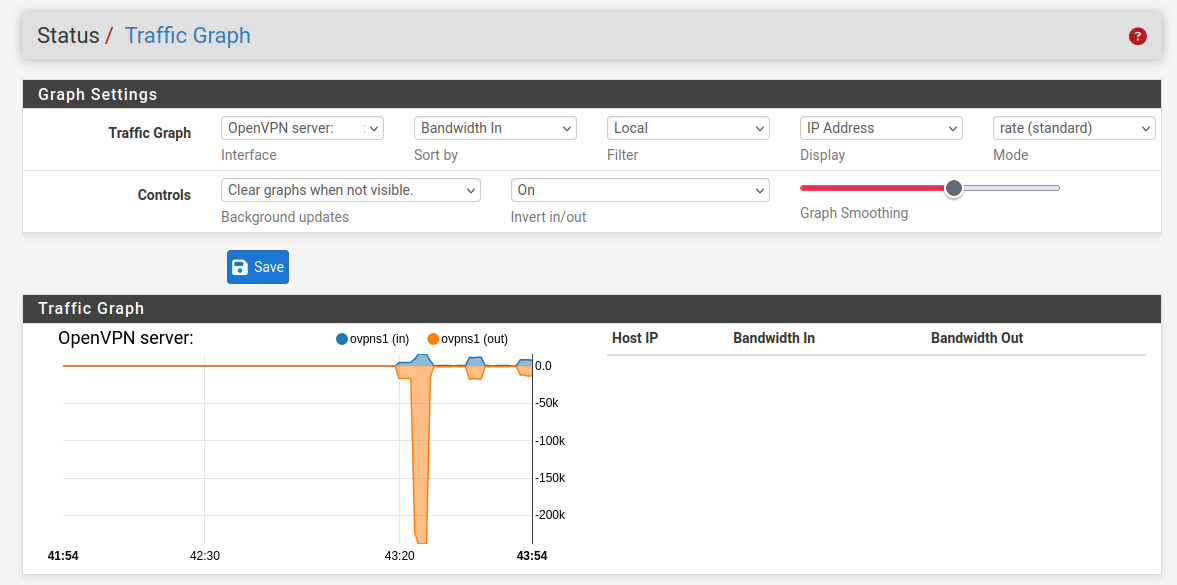
-
the dashboard widget wont show openvpn traffic, in fact, I cannot even select opt1 (which is my openvpn interface). So, only WAN is showing that traffic (plus other, which makes it somewhat like looking at the magic glass...regarding useful info)
-
-
@the-other said in Dashboard Traffic Graph VPN:
what works:
Correct that works fine.
@the-other said in Dashboard Traffic Graph VPN:
I cannot even select opt1
seems "different" that you can't even select it on the widget.
My solution to the flat line was to unselect that graph, so it doesn't even try to show the flat line. Deal with it another day. Since it looks like it is most likely a bug.