CPU load on 1100
-
@SteveITS my speed is rather low: 60/15 MBit/s
I started that top-command without the WebGUI running.
load ~2 (without pfblockerng)logged into GUI, load went up to 8, now it's 3-4
GUI rather laggy ... dashboard takes a while, shows CPU 100%
load now around 6
stopped/disabled telegraf
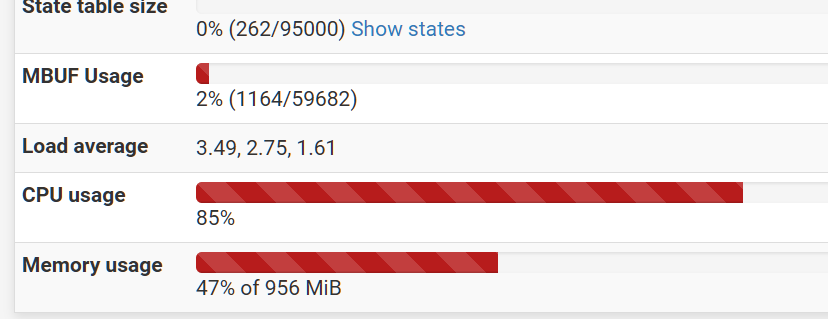
looks like this right now
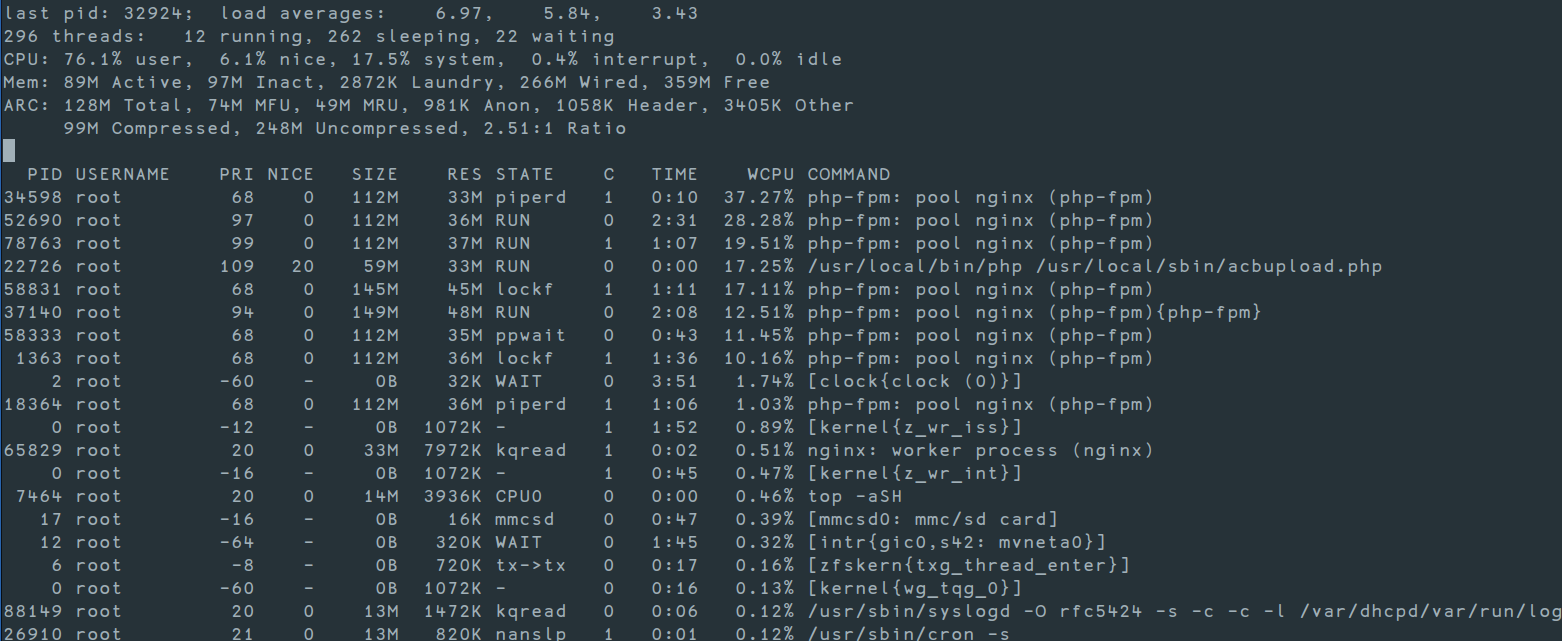
EDIT: now it's at ~4 again. I am NOT maxing out the line.
-
same issue with my 4100, only since this beta...
something in the PHP UI drives the CPU high when, i strongly suspect the Wireguard Widget
you can use the System Activity to view this, but from the shell, with a dashboard open and the Wireguard Widget active (no active wireguard connections):
ps aux | head -15
USER      PID %CPU %MEM     VSZ    RSS TT  STAT STARTED       TIME COMMAND
root       11 52.5  0.0       0     32  -  RNL  Sun13   7411:56.94 [idle]
root     5515 29.2  1.5  147720  60224  -  S    17:22      4:50.43 php-fpm: pool nginx (php-fpm)
root    12162 28.6  1.4  145672  58188  -  R    17:16      5:53.14 php-fpm: pool nginx (php-fpm)
root    64469 25.7  1.4  145672  57228  -  R    17:53      1:11.81 php-fpm: pool nginx (php-fpm)
root    99144 25.2  1.5  145672  60244  -  R    17:28      3:31.73 php-fpm: pool nginx (php-fpm)
root    36147 23.8  1.5  145672  59988  -  S    17:30      3:02.19 php-fpm: pool nginx (php-fpm)
root    63547 23.5  1.4  145672  57560  -  S    18:10      1:02.18 php-fpm: pool nginx (php-fpm)
root    58982 22.4  1.5  145672  62428  -  S    17:18      5:35.43 php-fpm: pool nginx (php-fpm)
root    12456 22.3  1.4  149320  58532  -  R    17:40      1:20.88 php-fpm: pool nginx (php-fpm)
root    33549  1.8  0.1   13604   3372  -  SN   13:11      0:07.55 /bin/sh /var/db/rrd/updaterrd.sh
root    82659  1.8  0.1   12944   2524  -  SNC  18:15      0:00.00 sleep 60
unbound 91955  0.3  5.8  279240 234416  -  Ss   13:10      3:39.22 /usr/local/sbin/unbound -c /var/unbound/unbound.conf
the
/var/log/nginx.logfile contains lots of entries like this one, and the UI has also just crashed:<171>1 2024-11-04T11:10:52.000000+00:00 xxx nginx - - - 2024/11/04 11:10:52 [error] 55002#100285: *45047 connect() to unix:/var/run/php-fpm.socket failed (61: Connection refused) while connecting to upstream, client: 2a02:xxxx, server: , request: "POST /widgets/widgets/wireguard.widget.php HTTP/2.0", upstream: "fastcgi://unix:/var/run/php-fpm.socket:", host: "xxx", referrer: "https://xxx/"killing all the processes doesn't make a difference, they restart all quickly consuming all the CPU, removing the widget, but with a number 6 traffic graph entries on a 2 second update interval
ps aux | head -15
USER      PID  %CPU %MEM     VSZ    RSS TT  STAT STARTED       TIME COMMAND
root       11 167.8  0.0       0     32  -  RNL  Sun13   7421:53.96 [idle]
root    49086   5.5  1.4  143624  55776  -  SN   18:56      2:35.89 php-fpm: pool nginx (php-fpm)
root    47810   4.0  1.5  143624  59864  -  SN   18:56      2:35.81 php-fpm: pool nginx (php-fpm)
...
and the load average drops very quickly, add the widget back and almost instantly:
ps aux | head -15
USER      PID  %CPU %MEM     VSZ    RSS TT  STAT STARTED       TIME COMMAND
root       11 127.3  0.0       0     32  -  RNL  Sun13   7423:15.52 [idle]
root    49086  22.1  1.4  147720  58132  -  RN   18:56      2:43.39 php-fpm: pool nginx (php-fpm)
root    48220  20.6  1.5  147720  58888  -  RN   18:56      2:42.10 php-fpm: pool nginx (php-fpm)
root    26035  19.7  1.4  145672  57036  -  RN   19:10      0:18.81 php-fpm: pool nginx (php-fpm)
root    49547  19.5  1.4  145736  57764  -  RN   18:56      2:42.58 php-fpm: pool nginx (php-fpm)
root    48034  15.8  1.5  145736  60856  -  RN   18:56      2:40.26 php-fpm: pool nginx (php-fpm)
root     9323  11.2  1.3  143624  53180  -  RN   19:14      0:01.63 php-fpm: pool nginx (php-fpm)
root    47810  10.6  1.5  143624  59928  -  SN   18:56      2:40.64 php-fpm: pool nginx (php-fpm)
root    50068   5.8  1.4  143688  58672  -  RN   18:56      2:36.93 php-fpm: pool nginx (php-fpm)
root        0   0.0  0.0       0   1168  -  DLs  Sun13    173:40.14 [kernel]
...
remove it again:
ps aux | head -15
USER      PID  %CPU %MEM     VSZ    RSS TT  STAT STARTED       TIME COMMAND
root       11 135.1  0.0       0     32  -  RNL  Sun13   7423:35.16 [idle]
root    50068  13.1  1.5  145736  60276  -  SN   18:56      2:45.20 php-fpm: pool nginx (php-fpm)
root    26035  10.3  1.4  145672  57160  -  SN   19:10      0:26.40 php-fpm: pool nginx (php-fpm)
root    48034   9.5  1.5  143688  60584  -  SN   18:56      2:47.49 php-fpm: pool nginx (php-fpm)
root    49547   9.2  1.4  143688  56520  -  SN   18:56      2:49.91 php-fpm: pool nginx (php-fpm)
root     9323   9.0  1.4  145672  57680  -  SN   19:14      0:07.45 php-fpm: pool nginx (php-fpm)
root    49086   7.8  1.4  143624  55896  -  SN   18:56      2:49.86 php-fpm: pool nginx (php-fpm)
root    48220   4.0  1.4  143688  56608  -  SN   18:56      2:47.47 php-fpm: pool nginx (php-fpm)
root        0   0.0  0.0       0   1168  -  DLs  Sun13    173:40.48 [kernel]
...
adding a previously unused widget (i chose Thermal Sensors) did not trigger the issue:
ps aux | head -15
USER      PID  %CPU %MEM     VSZ    RSS TT  STAT STARTED       TIME COMMAND
root       11 173.6  0.0       0     32  -  RNL  Sun13   7425:00.90 [idle]
root    48034   4.5  1.5  145736  62672  -  SN   18:56      2:49.87 php-fpm: pool nginx (php-fpm)
root    49086   4.4  1.4  143624  55968  -  SN   18:56      2:51.68 php-fpm: pool nginx (php-fpm)
root    50068   3.5  1.5  149320  60896  -  SN   18:56      2:47.84 php-fpm: pool nginx (php-fpm)
root    26035   3.1  1.4  145672  57428  -  SN   19:10      0:28.53 php-fpm: pool nginx (php-fpm)
root     9323   2.5  1.4  143688  55696  -  SN   19:14      0:09.23 php-fpm: pool nginx (php-fpm)
root    48220   1.7  1.4  143688  56688  -  SN   18:56      2:49.76 php-fpm: pool nginx (php-fpm)
root    49547   1.5  1.4  143688  56584  -  SN   18:56      2:51.52 php-fpm: pool nginx (php-fpm)
unbound 91955   0.7  5.8  279240 235984  -  Ss   13:10      4:20.96 /usr/local/sbin/unbound -c /var/unbound/unbound.conf
...
so I changed the WireGuard Widget "Refresh Interval" which was at its default value
1, setting it to10and the CPU usage dropped with the widget present:ps aux | head -15 USER PID %CPU %MEM VSZ RSS TT STAT STARTED TIME COMMAND root 11 152.4 0.0 0 32 - RNL Sun13 7428:59.53 [idle] root 71521 11.7 1.3 115608 51204 - SN 19:18 0:03.70 php-fpm: pool nginx (php-fpm) root 9323 9.2 1.4 149320 57984 - RN 19:14 0:25.05 php-fpm: pool nginx (php-fpm) root 85780 6.8 1.4 143624 54852 - SN 19:18 0:04.14 php-fpm: pool nginx (php-fpm) ...changing it back to
1pushed the CPU high again, and obviously dragged the load average with it!a quick check in the browser's network tab of the developer tool shows multiple outstanding
POSTrequests into thewireguard_widget.php, these requests are taking anywhere between 0.5 and 7 seconds to return, but mostly 3+ seconds, a value of3for the Refresh Interval seems to be the bare minimum without driving the CPU highthis led me to re-read the release notes and there is a nod to refresh intervals: https://redmine.pfsense.org/issues/15725 via https://docs.netgate.com/pfsense/en/latest/releases/24-11.html#dashboard but no other obvious WireGuard specific entry?
setting the value to
0appears to cause the widget to bePOSTs to stop, as makes some sense...given the bug is cited as fixed, presumably the issue is purely (for me at least, not sure about the original poster) down to the 1 second interval not being sufficient for the server to respond hence requests backing up, overloading whatever is going on server side?
for the time being, i'll just drop the widget, but i do note that the WireGuard status via
status_wireguard.phpfrom the WireGuard Status page itself also takes circa 3 seconds to return, every other request duration on that page (scripts, stylesheets etc.) all return200's in 1, 2 or 3ms, so very fasti presume something has been broken in this release?
-
@4e71 thanks for your detailled posting.
I disabled the wireguard widget ... and as long as I don't use the webGUI the load stays low ...Sure, I appreciate a fix also ;-)
-
We are looking at this....
-
This increase in CPU is the result of a bugfix for a related issue:
https://redmine.pfsense.org/issues/15725I bumped the default refresh interval for all widgets after that went in, but I missed WireGuard. I've pushed a change that increases the interval for WireGuard as well to more closely match the previous behavior.
-
M marcosm referenced this topic on
-
@marcosm thank you. looking forward to test that.
Is it coming via System-Patches or do I have to take it somewhere from bugzilla or so? -
 P patient0 referenced this topic on
-
There's no Wireguard widget on my 1100's dashboard, yet:
Dashboard has these widgets:
- Netgate Services And Support
- Service Status
- Disks
- ZDS
- System Information
- Gateways
- Interfaces
- UPS Summary
- pfBlockerNG
- Firewal Logs
-
@pfsjap It's possible other widgets are affecting it too. Remove all of them and re-add them one at a time to narrow down which one is doing it (if any).
-
R rpotter28 referenced this topic on
-
I also see a higher CPU-Load (25% all the time) on my Hyper-V-VM. Doesn't seem to be related to the widgets much.
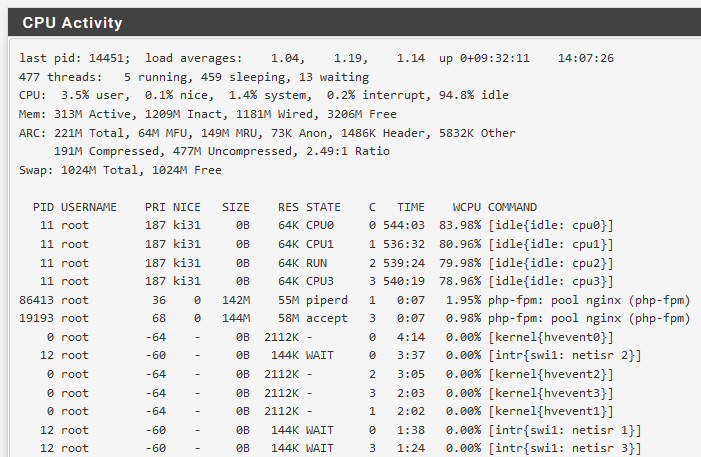
I run WireGuard a lot.
-
Hmm, odd. That shows only ~5% use. But also a 1.04 load average....
Are you able to catch anything else running and using CPU cycles?
-
24.11-RC now: still high load in dashboard. Looks the same to me in terms of this issue.
I will see if things change, the upgrade was only 15 minutes ago.EDIT: CPU load goes down now (in dashboard). I "minimized" all widgets, didn't have another idea ... load around 2.3 right now
-
The interval can be increased in the widget config. If you don't want the increased usage while on the dashboard, set them to refresh each e.g. 10s or remove them.
-
If you just run
top -HaSPat the CLI without the webgui open are you still seeing increased CPU usage? -
No, the load is at 0.2 - 0.4 when I do that. The top-command shows no high php-fpm activity now, sure, when no webgui is used.
Didn't play with the widget intervals yet ... I'd prefer that these values come with a working default ;-) / sure, can test that laterEDIT: load went down while I typed this. now 0.04 for example: nice
EDIT 2: disabled all widgets except "System Information". CPU load now showing ~22%. load in top around 1.0
-
@sgw What would you consider to be a working default and for which widgets? Would the defaults be different when additional widgets are added (i.e. when there's increased processing requirements)? Would that be considered the same for all hardware?
-
@marcosm I didn't want to offend anybody. Thanks for your work ...
-
@sgw No worries. They are valid concerns and questions :)
-
@marcosm ok, great.
I don't know if I can tell which defaults to use etc / I can try to enable some of the widgets and see what happens, then try to adjust things.
I assume I had too many widgets enabled für the netgate 1100 ... maybe the base load increased over time and with newer releases? Would it help to configure php-fpm somehow (more memory, more threads or something)?
Do the widgets get refreshed also when they are minimized?
-
@sgw Part of the issue before was that the refresh interval would increase along with the number of widgets. Hence the interval would essentially never be accurate - it'd be much higher which results in the decreased CPU load.
Since the resource usage is very hardware-dependent, it seems best to leave it up to the user to determine what's best in their situation. I think the current default behavior is acceptable with the default number of widgets. The firewall isn't really meant to be something you'd stay logged into indefinitely anyway; there are likely plenty of other situations where some GUI action results in a noticeable increase in resource usage.
-
@sgw Note if one leaves the dashboard open, that will also generate a continuous stream of log entries/disk writes because pfSense logs web server requests and each widget update is one.