Pfsense Grafana Dashboard and pfBlockerNG with pfSense 2.7
-
Hi there! I'm running pfsense 2.7, pfBlockerNG 3.2.0_6 (not the devel version).
The pfSense and pfBlockerNG portion of my firewall work well.I am trying to use the popular Grafana Dashboard found here...https://github.com/VictorRobellini/pfSense-Dashboard
On a separate ubuntu machine I am running grafana 10.1.1, influx2.7.1, telegraf 1.27.4I got just about everything working with the grafana dashboard. Needed quite a bit of tweaking. However I am struggling with getting the pfblocker stats of the grafana dashboard.
I tried the steps found here:
https://www.reddit.com/r/pfBlockerNG/comments/t1awl6/updated_patch_for_pfsense_2621x_ip_logging_issues/When I replace the pfblockerng.inc with the new one I get a crash report about my widgets on the pfsense 2.7 box. Luckly I made a backup copy of the original
Has anyone gotten the grafana dashboard to work with pfBlockerNG and pfSense 2.7? Much of the material out there is a bit dated. Any help is greatly appreciated.
Crash report begins. Anonymous machine information:
amd64
14.0-CURRENT
FreeBSD 14.0-CURRENT #1 RELENG_2_7_0-n255866-686c8d3c1f0: Wed Jun 28 04:21:19 UTC 2023 root@freebsd:/var/jenkins/workspace/pfSense-CE-snapshots-2_7_0-main/obj/amd64/LwYAddCr/var/jenkins/workspace/pfSense-CE-snapshots-2_7_0-main/sources/FreeBSD-src-RELCrash report details:
PHP Errors:
[04-Sep-2023 14:29:17 America/Chicago] PHP Fatal error: Uncaught Error: Undefined constant "PFB_FILTER_WORD" in /usr/local/www/widgets/widgets/pfblockerng.widget.php:382
Stack trace:
#0 /usr/local/www/widgets/widgets/pfblockerng.widget.php(520): pfBlockerNG_update_table()
#1 /usr/local/www/widgets/widgets/pfblockerng.widget.php(66): pfBlockerNG_get_header('js')
#2 {main}
thrown in /usr/local/www/widgets/widgets/pfblockerng.widget.php on line 382
[04-Sep-2023 14:30:17 America/Chicago] PHP Fatal error: Uncaught Error: Undefined constant "PFB_FILTER_WORD" in /usr/local/www/widgets/widgets/pfblockerng.widget.php:382
Stack trace:
#0 /usr/local/www/widgets/widgets/pfblockerng.widget.php(520): pfBlockerNG_update_table()
#1 /usr/local/www/widgets/widgets/pfblockerng.widget.php(66): pfBlockerNG_get_header('js')
#2 {main}
thrown in /usr/local/www/widgets/widgets/pfblockerng.widget.php on line 382
[04-Sep-2023 14:30:38 America/Chicago] PHP Fatal error: Uncaught Error: Undefined constant "PFB_FILTER_WORD" in /usr/local/www/widgets/widgets/pfblockerng.widget.php:382
Stack trace:
#0 /usr/local/www/widgets/widgets/pfblockerng.widget.php(520): pfBlockerNG_update_table()
#1 /usr/local/www/widgets/widgets/pfblockerng.widget.php(66): pfBlockerNG_get_header('js')
#2 {main}
thrown in /usr/local/www/widgets/widgets/pfblockerng.widget.php on line 382No FreeBSD crash data found.
-
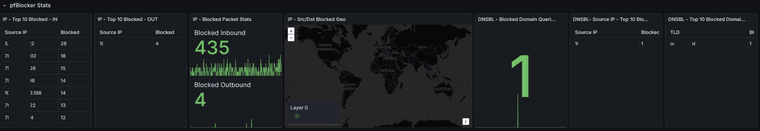
Ok my bad, it actually is working (except the map) with the default/original pfblockerng.inc that ships with pfsense 2.7, i just had it on a 5 minute view when troubleshooting and didnt see any near time blocks. But when I zoomed out to a 2day view, I got lots of block on both IP and DNSBL.
How do I get the map to work? I am using geomap panel in grafana.
-
I got it to work. I'd love to be able to get more specific with the locations instead of the center of a country, but for today this will do.
Here is code to the query made in grafana
SELECT "action" FROM "tail_ip_block_log" WHERE ("host" =~ /^$Host$/ AND "action" = 'block' AND "direction" = 'in') AND $timeFilter GROUP BY "geoip_code"::tagHere is grafan code to panel JSON```
{
"datasource": {
"uid": "$dataSource",
"type": "influxdb"
},
"fieldConfig": {
"defaults": {
"custom": {
"hideFrom": {
"tooltip": false,
"viz": false,
"legend": false
}
},
"mappings": [],
"thresholds": {
"mode": "absolute",
"steps": [
{
"color": "green",
"value": null
},
{
"color": "red",
"value": 80
}
]
},
"color": {
"mode": "thresholds"
}
},
"overrides": []
},
"gridPos": {
"h": 9,
"w": 6,
"x": 9,
"y": 16
},
"id": 563,
"maxDataPoints": 1,
"options": {
"view": {
"allLayers": true,
"id": "zero",
"lat": 0,
"lon": 0,
"zoom": 1
},
"controls": {
"showZoom": true,
"mouseWheelZoom": true,
"showAttribution": true,
"showScale": false,
"showMeasure": false,
"showDebug": true
},
"tooltip": {
"mode": "details"
},
"layers": [
{
"type": "markers",
"name": "Layer 1",
"config": {
"style": {
"size": {
"fixed": 5,
"min": 2,
"max": 10,
"field": "Time"
},
"color": {
"fixed": "red"
},
"opacity": 0.2,
"symbol": {
"mode": "fixed",
"fixed": "img/icons/marker/circle.svg"
},
"textConfig": {
"fontSize": 12,
"textAlign": "center",
"textBaseline": "middle",
"offsetX": 0,
"offsetY": 0
},
"rotation": {
"fixed": 0,
"mode": "mod",
"min": -360,
"max": 360
},
"text": {
"fixed": "",
"mode": "fixed",
"field": "geoip_code"
}
},
"showLegend": true
},
"location": {
"mode": "lookup",
"geohash": "geoip_code",
"lookup": "geoip_code"
},
"tooltip": true
}
],
"basemap": {
"type": "default",
"name": "Layer 0",
"config": {}
}
},
"pluginVersion": "10.1.1",
"targets": [
{
"datasource": {
"uid": "$dataSource"
},
"alias": "$tag_geoip_code",
"groupBy": [
{
"params": [
"geoip_code::tag"
],
"type": "tag"
}
],
"measurement": "tail_ip_block_log",
"orderByTime": "ASC",
"policy": "default",
"query": "SELECT count("action") FROM "tail_ip_block_log" WHERE ("host" =~ /^$Host$/ AND "action" = 'block' AND "direction" = 'in'), AND $timeFilter GROUP BY time(10m), "geoip_code"::tag",
"rawQuery": false,
"refId": "A",
"resultFormat": "table",
"select": [
[
{
"params": [
"action"
],
"type": "field"
}
]
],
"tags": [
{
"key": "host",
"operator": "=~",
"value": "/^$Host$/"
},
{
"condition": "AND",
"key": "action",
"operator": "=",
"value": "block"
},
{
"condition": "AND",
"key": "direction",
"operator": "=",
"value": "in"
}
]
}
],
"title": "IP - Src/Dst Blocked Geo",
"type": "geomap",
"description": ""
} -
@bnicolae can u give me full ur json config? Geo map not working 2
-
@dmshel80
I have the same issue. I get data from all but the Map isn't working: