How to get Suricata Alert logs to display correctly in Graylog Dashboard?
-
I have a Netgate SG6100 pfSense firewall and it's running Suricata.
Suricata is running in promiscuous mode right now, so nothing gets blocked at the moment.
For now, I only want to find out what traffic is flowing on the network and which alerts is Suricata generating that should get blocked when turning the block mode on in Suricata.To get an idea of all the traffic, I have set the log output of Suricata to send out EVE JSON logs to a Syslog server.
This is send to a Synology NAS (DS716+II so not the most recent one and is lacking support of AVX) and is running a Docker container for Elasticsearch 7.10.2, MongoDB 4.4.18 and Graylog 4.3.11. These older version don't require AVX support so this setup is working.Now, the logs are getting send to the NAS without a problem.
The problem is I can't select any fields to select the type of alerts Suricata is generating. Example: I want to create a widget on the Dashboard to see the top 10 critical alerts Suricata has detected and that possible might require some sort of acton.
Also, it would be nice to see a world map from where all the possible threats are coming from.Unfortunately, I can't select the required fields in Graylog to view these type of alerts.
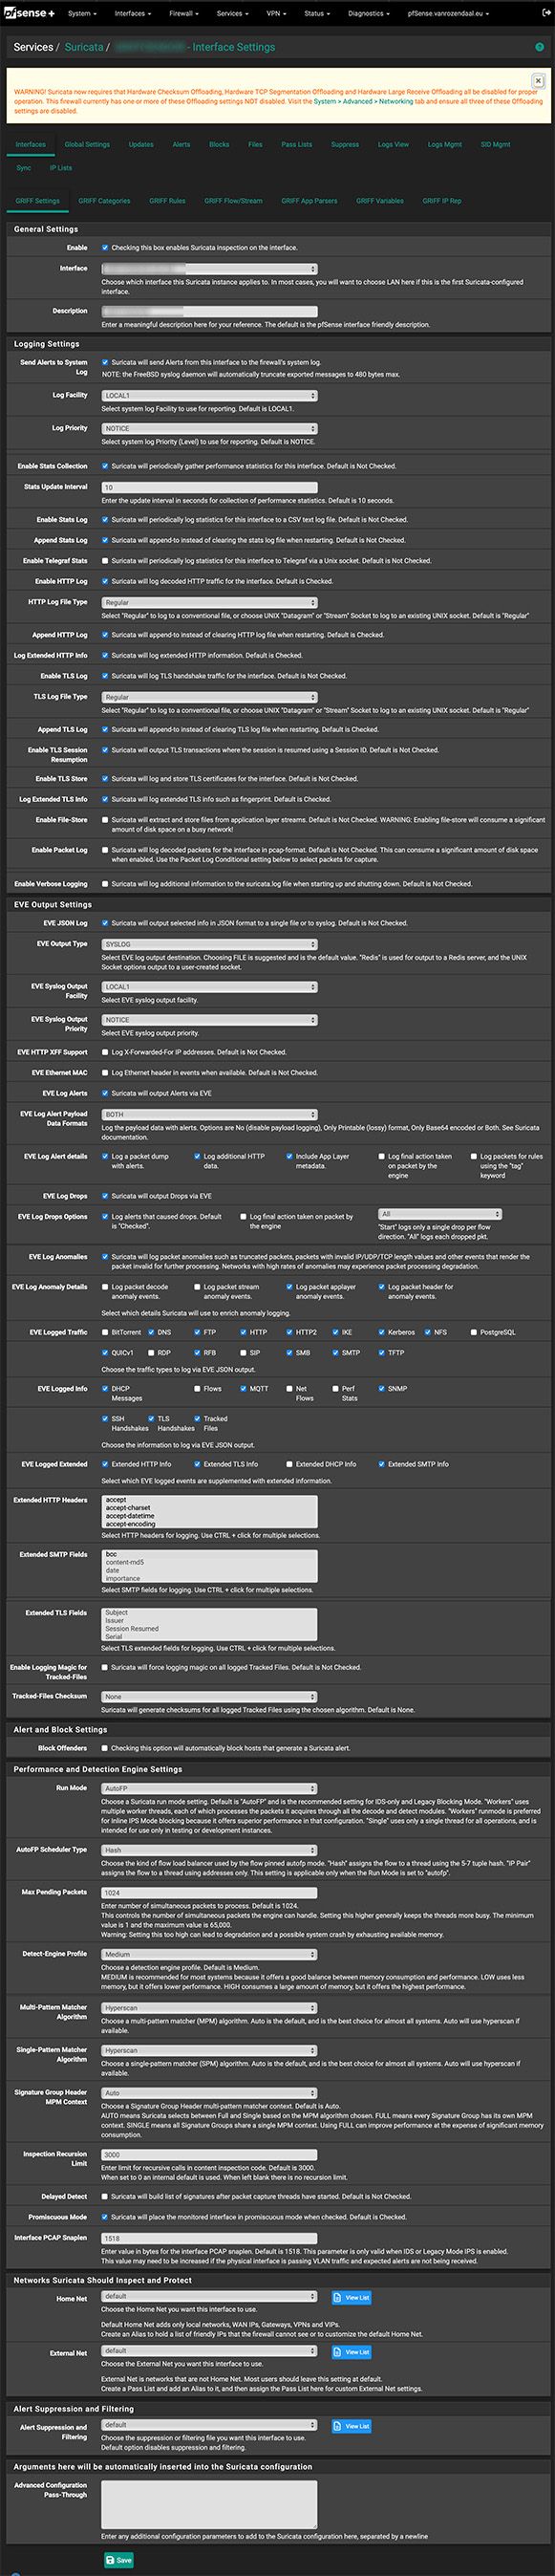
Is there a setting on pfSense or Suricata that I overlooked and that needs to be set for this type of fields to be selected on the dashboard widget?Attached you will find a complete overview of the Suricata Interface settings.
Yes, I know the warning says the hardware offloading needs to be all disabled but I have triple checked this in the network settings and they are indeed turned off.
The option Log Priority is now set to "Notice" but it gives no effect in the logfiles if I change this to "Alert" or any other value listed here.
-
@Stef_R said in How to get Suricata Alert logs to display correctly in Graylog Dashboard?:
Is there a setting on pfSense or Suricata that I overlooked and that needs to be set for this type of fields to be selected on the dashboard widget?
No, the Dashboard Widget only displays the first X alerts based on timestamp (where "X" is the number of alerts to display). The Dashboard Widget does not offer any type of alert filtering.
If you are exporting all the alert data to Graylog, then you would do your filtering there. Most folks configure an external ELK stack to get the nice filtering and pretty pie charts from Suricata data. The package on pfSense is dedicated solely to doing the actual IDS/IPS work. It is not designed for pretty logging and graphs
 .
.Note that when you export via
syslogthat the text field length is limited by FreeBSD to, I believe, 512 bytes if memory serves me correctly. Any text in the exported messages exceeding that limit is truncated. That's why most users employ ELK instead ofsyslogfor exporting EVE JSON data from Suricata to an external repository for filtering, processing, and presentation. -
In my understanding, ELK and Graylog are very similar programs although they each have their pros and cons.
Since I have the Graylog setup and working I was hoping to stay with Graylog. -
I do not personally use either, although I did once, several years ago, toy with an ELK setup. It was installed on a separate VM in my case.