PfBlockerNG Single core @ 100% for 5 minutes unscheduled
-
Hi all.
Just wondering if I’m the only one that noticed this after upgrading to 25.07 and pFblocker 3.2.7:
I have my pfBlockerNG set to update every night at 02:00am and it does (like it also did before).
But after the upgrade I also have a pfBlockerNG PHP script running at about 16:00 on one box and 19:00 on another. The command is:
/usr/local/bin/php /usr/local/www/pfblockerng/pfblockerng-php dcc(php)This process eats a lot of CPU, about 1 minutes worth of one core @ 100% on my 6100 and one core @ 100% for about 5 minutes on the less powerfull 2100 box (This is 50% of the 2100 CPU power).
It seems it does a GEOIP update as that is the only thing thats referenced in the extras.log of pfBlockerNG.Why is this suddently so different from running on 24.11? And why is this not done at 02:00 when its scheduled to update?
-
That is normal - the download of the GeoIP asn data is randomized (once when the system is setup) Why it runs at different times on different boxes.
When you schedule pfblocker to run at 2:00 all the ASN files are then already local and not downloaded again.Put it another way, the older version would download every ASN file, every time, pfblocker ran an update via cron.
so if you ran pfblocker hourly, you would be downloading ASN data file for your selected ASNs every time it ran the cron job ran.
Now the download only happens once (at the preselected randomized time) and you get every ASN available )
You can run the pfblolcker cron updates as many times as you like and they will not download anything (Geo /ASN) related. it will just update those lists from the local data. You can even add a "new" ASN to your selection, and it will already be available.on a 2100 this ASN database download (as you noted is logged in the extras.log) takes all of 15 seconds here. I would likely never see a CPU hit specifically related to this download.
Download Process Starting [ 08/14/25 07:45:01 ] /usr/local/share/GeoIP/asn.mmdb 200 OK /usr/local/share/GeoIP/asn.csv.gz 200 OK ASN Lookup Table has been updated [ 08/14/25 07:45:05 ] Download Process Ended [ 08/14/25 07:45:16 ] -
@jrey That makes a lot of sense to do it this way. But why am I seeing soo much CPU load when this happens compared to you and my own setup before?
5 minutes @ 50% CPU (one core @ 100%) on a 2100. I did not have this load at the scheduled reload at 02:00am before on 24.11. -
the 200 in the log file does not represent the size of the download, but rather the status as in "200 OK"
and applies only to the ASN data files as noted in my case. the combined size of those two files is around 19MB as I recall, I'd have to check, but you can also just check the directory noted.I don't use the MaxMind for Geo Data, look at the log files
can you provide a log file (or part there of) for both the extras and pfblockerng log for the time frame you see the spike.
anything in the error log for pfblockerng ?
Where are you measuring the CPU spike? provide that data too if you can.. -
@jrey It makes sense it’s the GEOIP DB if it has that size. It will take lots of cpu time split a file of that size into usable countries, regions and custom pfsense lists where I use GEOIP data. The 2100 CPU is anaemic (low clocked two core ARMv8 CPU) which is why it’s really noticable on that. I have made the measurements in an SSH shell using top to avoid the dashboard widgets interference.
It is exactly one core a 85 -100% for 5 minutes with a few breaks here and there.One thing - can I change the cron job to run at another time? 19:00 is where I have the most load on my 2100, so it would be better if it ran at say 03:00am
-
Clarify "it makes sense if the GEOIP DB has that size" are you referencing the asn data as I have shown or the maxmind data?
the asn data takes all of 15 seconds to download and process. Not really any "magic" going on there, you can see the mmdb is only a download referenced and the asn.csv.gz is basically just unzipped.
I can't comment on the maxmind data specifically because I don't use for my geo location. But I can see what the code should be doing.
seeing your actual log file will help determine where your specific spike may be coming from, but if I had to guess from looking at the code and my timing with respect to the asn parts of it I would guess this is most likely to be an issue with the maxmind parts - timing should be in the log.
can you change when it runs ? no, not directly, there is no way to do this without changing the code to target a specific time when it creates the cron job in the first place. No you can't change the timing of the cron job and have it stick, it will eventually just go random again. On the other hand, yes, because I changed the code here so it always creates the same "not so random" time.. runnning at same time every day since this code change first became available in the pfblockerNG update for 24.11 that came out months ago, well before 25.07
curious you originally said "noticed this after upgrading to 25.07 and pfb 3.2.7" were you running the "new" format of asn data before? (would have only been possible if you upgraded from 24.11 with the latest version of pfb installed) you would have entered and ASN key at some point to make it work. did you do that under the prior version and just now with 25.07) it's likely not significant, but then again ....
That likely won't help your spike, other than moving it to a different time. I moved it here to a static ("not so random") time for other reasons, nothing to do with system load at the time..
Log files would be helpful. (just the snippet that applies to this time, from extras, error and pfblockerng logs there may be nothing in error or pfblockerng related to the time it is running. .
-
@jrey I found the DB sizes on Maxmind, and they are rather big, so i'm figuring it just takes time for such an anemic CPU to sort all that out. That is also what the extras.log says:
Download Process Starting [ 08/15/25 19:00:01 ]
/usr/local/share/GeoIP/GeoLite2-Country.tar.gz 200 OK
/usr/local/share/GeoIP/GeoLite2-Country-CSV.zip 200 OK
Download Process Ended [ 08/15/25 19:00:06 ]Country code update Start
Processing ISO IPv4 Continent/Country Data
Processing ISO IPv6 Continent/Country Data [ 08/15/25 19:02:09 ]
Creating pfBlockerNG Continent PHP files
IPv4 Africa [ 08/15/25 19:03:24 ]
IPv6 Africa [ 08/15/25 19:03:27 ]
IPv4 Antarctica [ 08/15/25 19:03:28 ]
IPv6 Antarctica
IPv4 Asia
IPv6 Asia [ 08/15/25 19:03:37 ]
IPv4 Europe [ 08/15/25 19:03:43 ]
IPv6 Europe [ 08/15/25 19:04:10 ]
IPv4 North America [ 08/15/25 19:04:30 ]
IPv6 North America [ 08/15/25 19:05:04 ]
IPv4 Oceania [ 08/15/25 19:05:29 ]
IPv6 Oceania [ 08/15/25 19:05:31 ]
IPv4 South America [ 08/15/25 19:05:32 ]
IPv6 South America [ 08/15/25 19:05:35 ]
IPv4 Proxy and Satellite [ 08/15/25 19:05:37 ]
IPv6 Proxy and Satellite
IPv4 Top Spammers [ 08/15/25 19:05:38 ]
IPv6 Top Spammers [ 08/15/25 19:05:39 ]
pfBlockerNG Reputation Tab
Country Code Update Ended -
@keyser FWIW my 2100 takes about 4 minutes also and since the log goes back a ways I can see it’s grown over time. For instance IPv6 North America has gone from 17 seconds to about 45 seconds.
-
if you want the less random more static time this:
the code that needs to be changed is in pfblockerng.inc
best to make yourself a patch file and apply it that way , so if the package is reinstalled (updated) or whatever. you can just "verify" the patch and just reapply.
I ran with this (but different time) under 24.11 when I upgraded to 25.07 just verified and re-applied the patch.if you want look to look at at the code for the lines being changed just above that "if statement" is the comment
// Define pfBlockerNG MaxMind/TOP1M/ASN Cron jobname the patch whatever you like and set these behaviour options
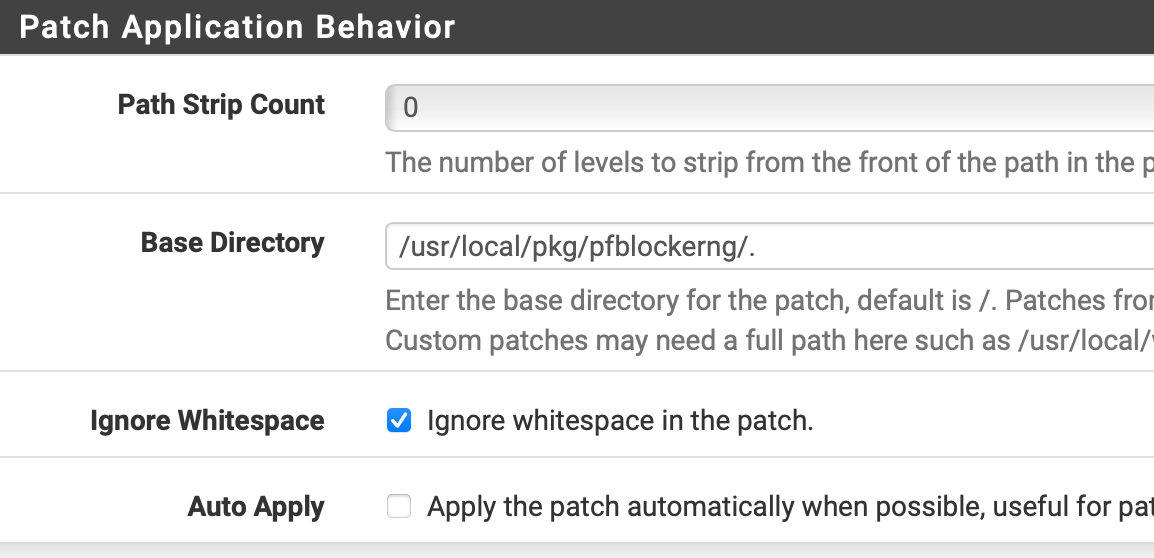
This is the patch contents (made just for you to hit the time before 2am)
--- pfblockerng.inc.orig	2025-08-16 10:30:40
+++ pfblockerng.inc	2025-08-16 10:29:52
@@ -10669,8 +10669,8 @@
 	if ($pfb['enable'] == 'on') {
 		$pfb_gcmd = "/usr/local/bin/php /usr/local/www/pfblockerng/pfblockerng.php dcc >> {$pfb['extraslog']} 2>&1";
 		// CRON hour is randomized between 0-23 Hour to minimize effect on Servers
-		$pfb_gmin	= '0';
-		$pfb_ghour	= rand(0,23);
+		$pfb_gmin	= '35';
+		$pfb_ghour	= '1';
 		$pfb_gmday	= '*';
 		$pfb_gmonth	= '*';
 		$pfb_gwday	= '*';
In this I changed the time from the random top of the hour to 1 35 am (just before your 2am pfblocker update and with time to spare.
However, I would recommend anything that is not at the top of the hour (0) minutes as that is when almost everything else gets scheduled.) FWIW. I also changed the "top" of the hour on my system so the pfblocker cron setting so that everything is offset by 30 minutes, and therefore don't conflict with other jobs that are also at 0 minutes (as most are)
If you make this change on the dialog, then you might need to change the above, so it runs at say 1 15 am (adjust accordingly to suit your needs)pfblocker general page cron settings GUI

next time it creates the job it will schedule it for the now not so random time of your choice.
If you want to adjust the time and the patch has been applied, revert - edit the patch times (minutes/hours) only - then reapply. (unlikely you want to change the day month or week day, but if you did you would need a modified patch)
-
@jrey Thank you so much for the detailed explanation and help. I will adapt and apply the patch to move the job timing like suggested at 01:35

Are you just a user or are you also involved in package maintenance on one or more packages?