Dashboard memory usage vs. Monitoring Memory
-
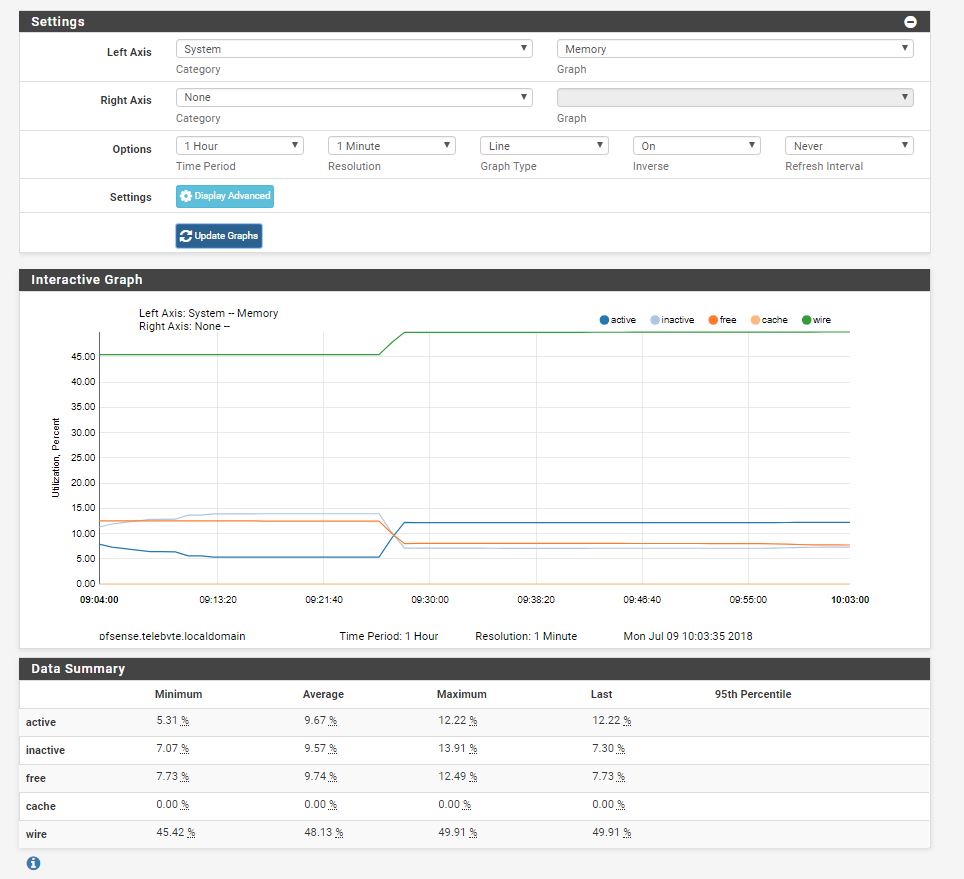
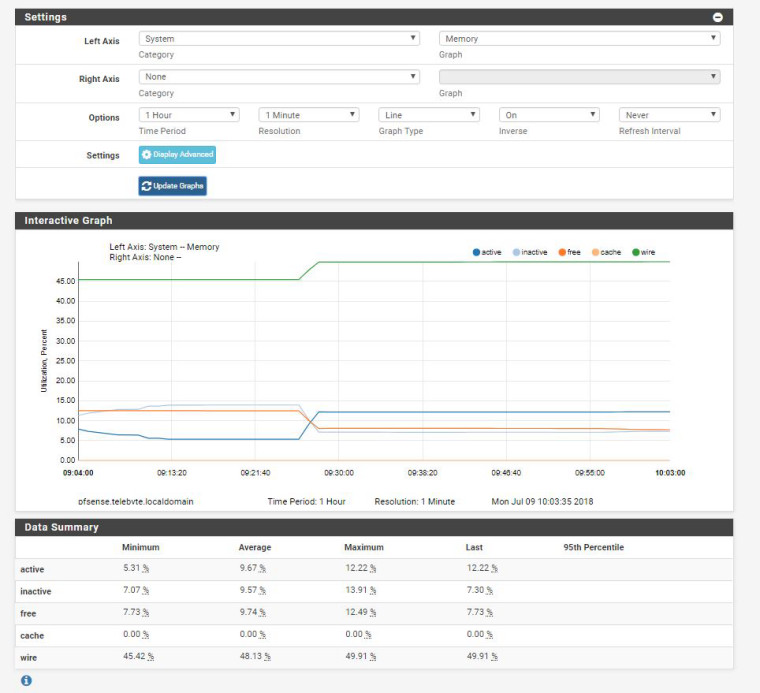
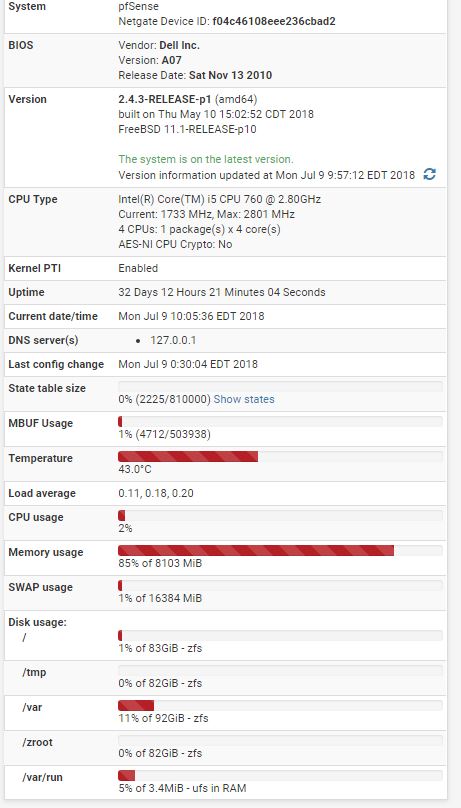
I think I might be missing some bit of information. It used to be that the memory usage reported on the dashboard would match up with the total memory usage reported by going the Monitoring tab and checking the current memory usage graph. Then adding the wire, active, and inactive would give me the same value as the number reported on the dashboard. I noticed my dashboard memory usage was a little unusually higher than normal. It reported 85% usage. So I check my graphs and it doesn't add up. Even my worst case max numbers don't add up to that. What am I missing? See my screenshots and let me know if I'm missing something.
-
I was looking at this again today and now I have another question. If I look at the memory at any given point along the graph, adding up all the numbers doesn't equal 100. How can that be?
-
This post is deleted!