My new pfBlockerNG is showing 100% on the dashboard. That's not right is it?
-
So I'm a Pi-Hole guy. I had some Pi's lying around and happened to pi-hole while watching some webshow or something. Seemed like a cool little side project. For some reason by blocking stuff I think it makes us feel better. I was on a hunt to eliminate ads.
Fast forward and my firewalls are running on nice robust boxes that have a decent amount of memory and decent processors so when I came across pfBlockerNG it seemed like another nice project and eliminated maintining the pi on my network.
I'm pretty much at the default installation at this point and have whitelisted a bunch of stuff to restore some websites and google apps.
I notice that the percentage is always at 100. The one on the DNSBL line. Why is that so? I was expecting it to show a percentage of traffic that it blocked.
Thanks,
Roveer
-
The Widget lose count of the Unbound total queries when unbound reloads.
Unbound can reload during a Force Reload, Force Update, or Cron update when there are Unlock domains active. It may reload when a Wan IP change, DHCP server restart, Interface change, etc.When this happen, click on the Trash icon on the right of Packets, select DNSBL.
There is also a Widget setting to clear counters Daily or Weekly.
-
@ronpfs said in My new pfBlockerNG is showing 100% on the dashboard. That's not right is it?:
The Widget loose counts of the Unbound total queries when unbound reload.
Unbound can reload during a Force Reload, Force Update, or Cron update when there are Unlock domain active. It may reload when a Wan IP change, DHCP server restart, Interface change, etc.When this happen, click on the trash icon on the right of Packets, select DNSBL.
There is also a Widget setting to clear counters Daily or Weekly.
Cleared the packet counts, set the widget to reset daily and it seems to be working. On pi-hole it always hovered around 50%. Let's see what I get on pfBlockerNG.
Thanks so much for the quick response.
Roveer
-
Well...
I just went back to my dashboard after making the changes suggested above (on Friday night - initially reset packet count, set widget to reset daily) and several days later I'm still seeing 100%. Any suggestions on how to fix this?
Thanks,
Roveer
-
Look at the resolver logs to see how often it reload.
-
@ronpfs said in My new pfBlockerNG is showing 100% on the dashboard. That's not right is it?:
Look at the resolver logs to see how often it reload.
Resolver log has entries from Nov 13th. Nothing more current.
It's 1:18am as I am posting this and my dashboard is showing 11.08%. Last night it was 100%. So it looks like it reset counters at midnight. numbers are very low.
No manual activity on firewall (reboots etc)
-
Sometimes you need to restart unbound from the Services Status tab in order for unbound to log to the resolver log.
-
unbound restarted, this wasn't initiated:
Nov 19 19:39:35 unbound 14690:0 notice: Restart of unbound 1.7.3.
dashboard at 100%.
Is this related to the restart? Is there a way I can find out why it restarted? I'd like to figure out what is happening here.
Thanks,
Roveer
-
@roveer said in My new pfBlockerNG is showing 100% on the dashboard. That's not right is it?:
Is this related to the restart? Is there a way I can find out why it restarted? I'd like to figure out what is happening here.
How many domains do you have in DNSBL?
Are you using "DHCP Registration" or "Static DHCP" in the DNS Resolver settings?In the pfBlockerNG widget -> wrench settings -> "Enter DNSBL Resolver Query frequency" -> Increase to 10 seconds to see if that improves it...
I haven't been able to reproduce this in my tests, but @RonpfS (my most vocal/best beta tester .. :) ) has said this was an issue... So I will have to spend some more time to find the root cause...
-
@bbcan177 said in My new pfBlockerNG is showing 100% on the dashboard. That's not right is it?:
@roveer said in My new pfBlockerNG is showing 100% on the dashboard. That's not right is it?:
Is this related to the restart? Is there a way I can find out why it restarted? I'd like to figure out what is happening here.
How many domains do you have in DNSBL?
Are you using "DHCP Registration" or "Static DHCP" in the DNS Resolver settings?In the pfBlockerNG widget -> wrench settings -> "Enter DNSBL Resolver Query frequency" -> Increase to 10 seconds to see if that improves it...
I haven't been able to reproduce this in my tests, but @RonpfS (my most vocal/best beta tester .. :) ) has said this was an issue... So I will have to spend some more time to find the root cause...
How do I tell how many domains are in DNSBL?
Currently DHCP Registration and Static DHCP are both checked in the resolver. Is this a misconfiguration? I probably turned some of this stuff on so I would see names in BandwidthD (which is does).
Raised value to 10 seconds.
-
@roveer said in My new pfBlockerNG is showing 100% on the dashboard. That's not right is it?:
How do I tell how many domains are in DNSBL?
Widget will show the total DNSBL Entries or review the pfblockerng.logCurrently DHCP Registration and Static DHCP are both checked in the resolver. Is this a misconfiguration? I probably turned some of this stuff on so I would see names in BandwidthD (which is does).
When using these options and depending on how you have configured DHCP; it can be restarting Unbound on a more frequent basis to update the DHCP entries (defaults to every hour i believe).
The more domains that are used, the longer it may take to reload the Resolver. So if you can, best to change the DHCP lease time to something longer. Its also good to set DNSBL to update once per day (or use the new Live Sync feature)
-
@bbcan177 said in My new pfBlockerNG is showing 100% on the dashboard. That's not right is it?:
Widget will show the total DNSBL Entries or review the pfblockerng.log
I turned on live sync and restarted unbound from the services menu and cleared the counts from the widget. It now goes to 100% at the first update. Before It would start at a lower number and it would eventually make it's way to 100%.
-
Run a Force Reload - DNSBL to enable the changed Live sync setting. Clear the DNSBL counter following the update.
-
@bbcan177 said in My new pfBlockerNG is showing 100% on the dashboard. That's not right is it?:
Run a Force Reload - DNSBL to enable the changed Live sync setting. Clear the DNSBL counter following the update.
Did the force reload, waited for it to finish, cleared counters and it went to 100% at first update again.
-
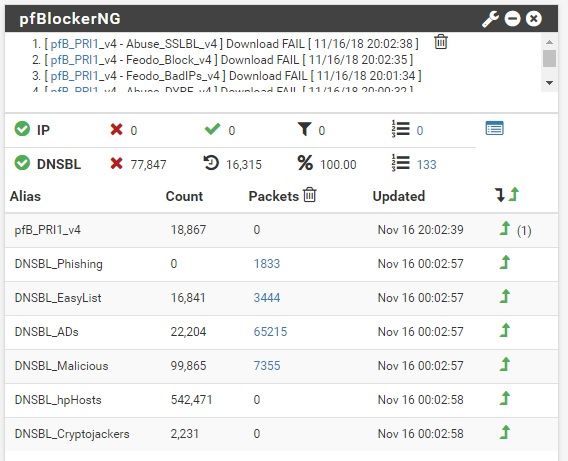
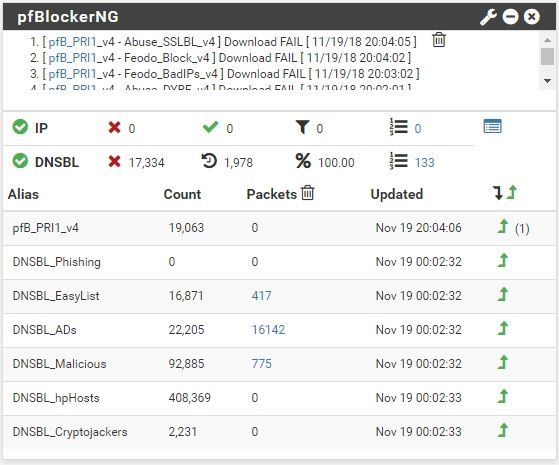
When you clear the DNSBL counters, are they all going to zero on the DNSBL line? Your previous screenshot seems to show 17k blocked events after clearing the counters?
-
@bbcan177 said in My new pfBlockerNG is showing 100% on the dashboard. That's not right is it?:
When you clear the DNSBL counters, are they all going to zero on the DNSBL line? Your previous screenshot seems to show 17k blocked events after clearing the counters?
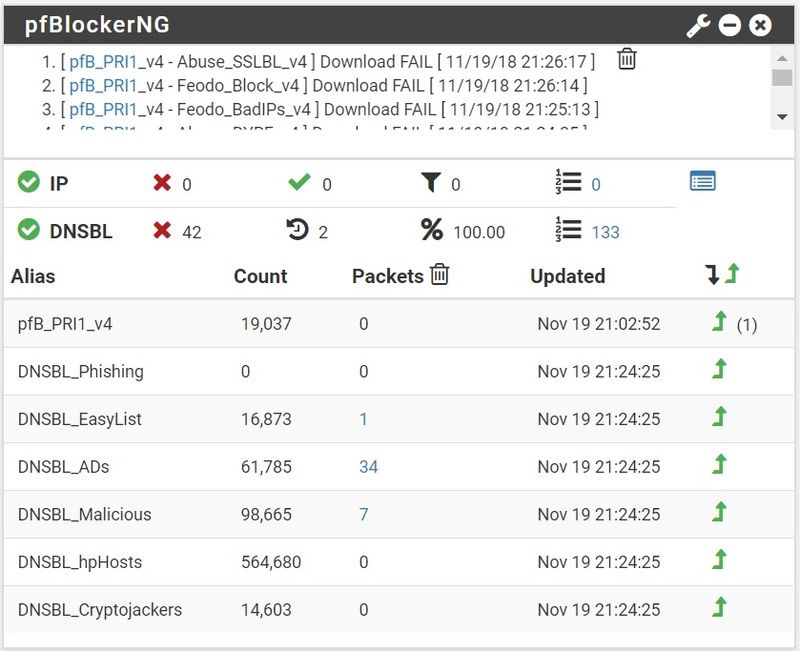
I cleared counters again and watched. (EDIT: i've been clearing "packets". If I'm supposed to be clearing counters, I need to know where I do that) This time It took 6 updates before it went to 100% and during the updates the percentages dropped a few times but then went to 100% (current screen shot)
-
So from the screenshot, it blocked 42 events with only 2 Resolver DNS queries... So for some reason its clearing the Resolver queries counter prematurely... I will have to try and replicate this and see what I can find... Maybe try without DHCP Reg enabled in the Resolver to see if we can limit the issue down?
Another option is to increase the Resolver Log verbosity to "2" and review the Resolver.log for any other clues to see what is occurring when it goes to 100%. (can run this cmd from the shell to see the live tail events:
clog -f /var/log/resolver.log) -
This firewall has a ipsec vpn using dyndns address. I'm pretty sure the only network I have defined in pfBlockerNG is LAN. Just wanted to throw that out there. I'm going to turn off the DNS registration and see what happens. Then I'll change the verbosity but I'll have to do that tomorrow.
-
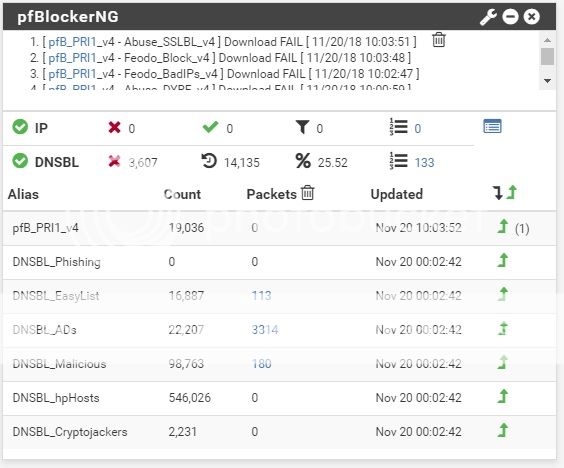
It seems to be behaving better today. So last night before midnight I had unchecked the DHCP registration per your request and it went right back to 100% after clearing the counts.
I'm assuming at midnight it did an update/reset.
This morning I'm seeing the following:
-
With DHCP registration checked, unbound restart with every new lease.
When you save DHCP settings, it also restart unbound. So it "normal" behaviour to see the 100% in the Widget.