States
-
So the settings at
GUI >> System >> Advanced >> Firewall & NAT >> Firewall adaptive timeouts
aren't meant to workAnd the
Firewall Rule >> Extra Options >> Advanced >> State type = None
Isn't meant to achieve anythingAnd to be honest, I'm not sure that any states get removed when a connection closes. It looks to me like all connections are staying open. Every time my max state limit is reached, pfsense just stops responding until I remove all states with a console shell command 'pfctl -F states' and they they start to build up again very quickly. Not all of my open states are from my BIND9 - it is just by far that most of them are. Over 200000 states in less than 10 hours - and this has only started to happen in the last week or so, probably since upgrade to 2.4.4
How can I check that states are actually getting removed?
And one other thing that is really weird - my traffic graphs are all over the place, it is like the time jumps backwards and forwards every few seconds
-
@outbackmatt said in States:
GUI >> System >> Advanced >> Firewall & NAT >> Firewall adaptive timeouts
aren't meant to work
And the
Firewall Rule >> Extra Options >> Advanced >> State type = None
Isn't meant to achieve anythingyes they are meant for to work. but in any normal situation, the default are fine.
if the numbers of states keep rising indefinately, then something is seriously wrong.if there is an issue with time, then lots of weirdness can happen ... are you running this in a VM ? if yes, disable host/vm time sync
-
are you running this in a VM ? if yes, disable host/vm time sync
Yes I am running on a hyperV
I have disabled time Sync, and that seems to have fixed my 'states' issue following a rebootMy traffic graphs till look a mess , but that's no big deal
Thanks for the host time trick
-
Perhaps that is not yet sorted
18 hours since last post and 126970 states just got cleared -
By default, a UDP state is automatically removed after 60 seconds of inactivity. Setting the firewall to Conservative in System > Advanced, Firewall & NAT increases that to 15 minutes.
pfctl -stwill show you the current timeouts.You would likely need two rules to pass the UDP traffic without creating any states:
INSIDE (LAN) Pass UDP source BIND_SERVER dest any port 53 State: No
OUTSIDE (WAN) Pass UDP source any dest BIND_SERVER port 53 State: NoAnd I think the following will work for TCP:
INSIDE (LAN) Pass TCP source BIND_SERVER dest any port 53 TCP Flags any State: No
OUTSIDE (WAN) Pass TCP source any dest BIND_SERVER port 53 TCP flags any state: NoYou probably also need floating rules that match these in the outbound direction on the other interface to keep states from being created there too.
Really hard to believe you're doing 100K DNS queries a minute though. I'd fix that instead.
-
The thing is that I really am NOT doing 100000 DNS checks a minute.
I just did another 'pfctl -F states' - the previous one was 16 to 18 hours ago, and 165109 states were cleared.I doubt that I have done even half that number of DNS checks in that same 18 or so hours.
My mailserver isn't very busy, I handle maybe 500 messages per day, and there should be about 20 DNS lookups for each of those, and perhaps a DNS check for some other incoming connection attempts (to see where the connection is from) for those accessing my websites, or trying to connect IMAP or POP (eg users and hackers). I have only about 80 or so users, and I block say six or seven hacking attempts per day.This just doesn't match the number of states at all. It is really hard to see how I could get to 200 000 states per day, even if most of them are duplicated, but for different interfaces.
It is like all of the states are remembered and none are dropped at all. I was thinking if I didn't record states for port 53, that it would lighten the load and I may get more than 24 hours without having to manually force the dropping of all states.
I can't check the web based GUI for states as the GUI times out when the states table is large, the states display doesn't show created time anyway. I have many tens of thousands of states that show NO_TRAFFIC:SINGLE or SINGLE:NO_TRAFFIC, not all of these are port 53, but many are.
There is clearly a problem in my setup, but I have no idea on how to track it down.
My entire rule set is three NAT Port forward auto generated rules.
#1 forwards mail ports to my mailserver
#2 forwards web server ports to my web server
#3 custom RDP port forward to my desktopThis isn't a fancy setup.
This is intended to protect my home office from outside attack, and safeguard my teenagers while they web surf.What could be causing the states to be persistent?
This seems to have started with 2.4.4 -
Really hard to say based on what has been shown.
pfctl -vvss | grep -A3 _some_criteria_where _some_criteria is something like a remote DNS server that gets used all the time and has a bunch of states but is manageable to work with. Something to narrow it down.That will show you when the state was created, when it last passed traffic, etc.
NO_TRAFFIC:SINGLE should drop off fairly quickly by default.
-
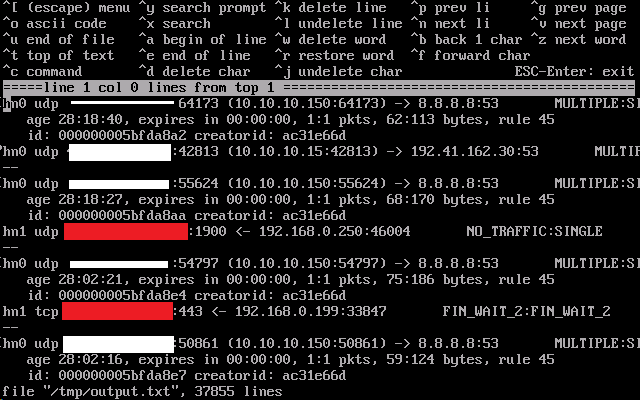
running 'pftcl --vvss | grep -A3 8.8.8.8:53 >/tmp/output.txt creates an output file that starts like this (37855 lines in total!!)

8.8.8.8:53 is Google DNS server which is queried reasonably frequently it seems from my BIND9
Does that first one look to be 28 hours, 18 minutes and 40 seconds old, and already expired?
Whiteout is my public IP address
Red-out is other public IP addresses -
This post is deleted! -
All of those
expires in 00:00:00are very very strange.It's like your states aren't expiring out of the state table when they should. I've never seen anything like that before.
I would completely revisit anything you have done to try to solve this problem. Custom rules, state timeouts, etc.
-
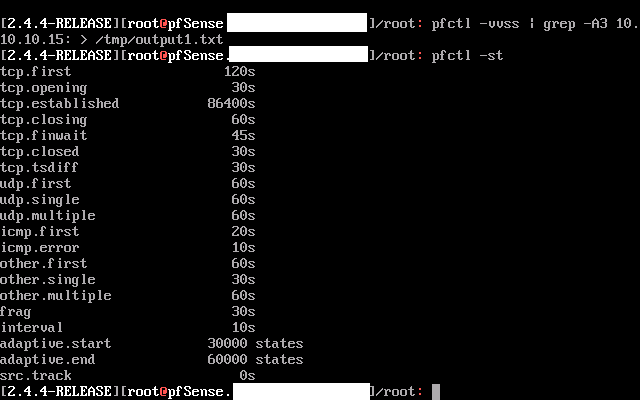
What is the output of
pfctl -st?? -

-
Those expired states should be being purged every 10 seconds based on
interval.I would undo everything you have done to try to solve this. All adjusted timeouts, adaptive settings, etc.
These are the defaults for mode Normal:
tcp.first                   120s
tcp.opening                  30s
tcp.established           86400s
tcp.closing                 900s
tcp.finwait                  45s
tcp.closed                   90s
tcp.tsdiff                   30s
udp.first                    60s
udp.single                   30s
udp.multiple                 60s
icmp.first                   20s
icmp.error                   10s
other.first                  60s
other.single                 30s
other.multiple               60s
frag                         30s
interval                     10s
src.track                     0s
This points to something with the clock as has been mentioned before:
https://bugs.freebsd.org/bugzilla/show_bug.cgi?id=222126
-
Reading the link that you provided, the suggested 'fix' (last post) is to upgrade to FreeBSD 12
which isn't general release yet, although it is getting close (perhaps weeks away)
I created a new PFsense VM on my hyperV server running 2.3.5-Release, and already it seems that my internet is MUCH smoother and the states tables is NOT growing outlandishly, and my traffic graphs display nicely.
Problem is that I can't install any packages (mail reports, snort etc) unless I 'upgrade' to the newest version of PFSense.
I'm open to suggestions.
I'll probably try 2.4.1 as that is the next upgrade and I will see what happens -
Looking quickly at the release notes it seems that PFsense 2.4.0 was the first to use FreeBSD 11.x
And the instant that I upgrade 2.3.5 to current release the traffic graphs stop being normal, and the states table grows etc
(another observation I made is that while the newer release is booting on the VM, the Caps light on the keyboard toggles on/off hundreds of times per second)I'll run up another 2.3.5 and use that without the extra packages for the time being
-
Just a followup
2.4.x continues to have this problem
2.3 was working, but of course there are issues with using an old build, including the lack of packages.I have installed a clean install of the latest 2.5 build, and it is works as well or better than the 2.3 that I have been running.
2.5 is based on FreeBSD 12.