Huge Suricata Stats Logs
-
I have a relatively recent deployment with an issue with the Suricata Stats Logs using all disk space.
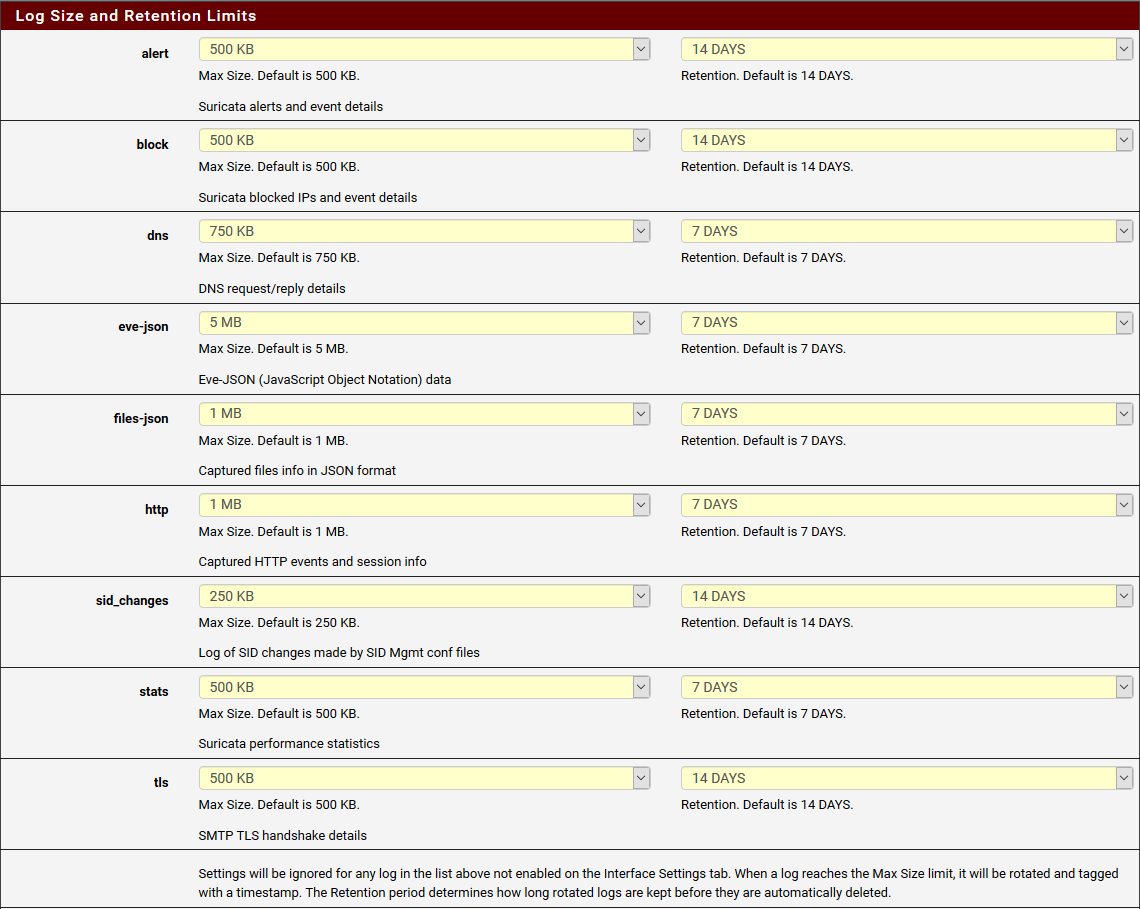
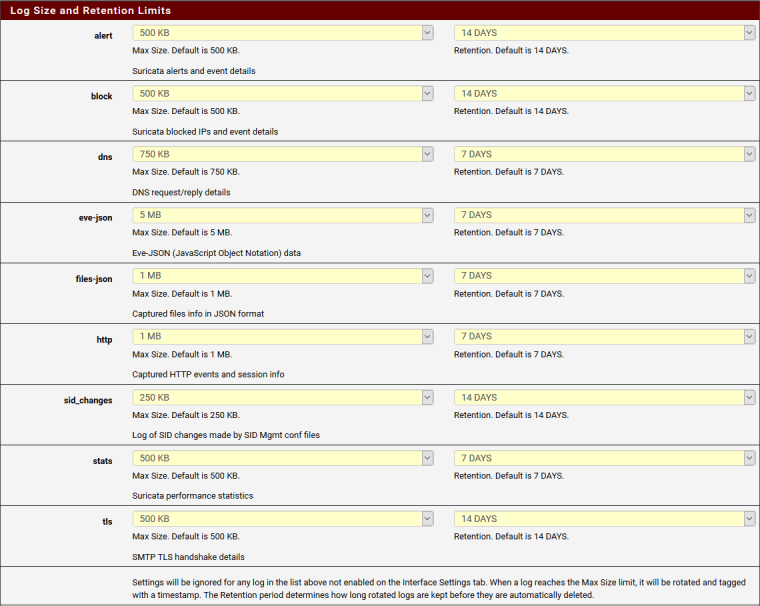
/var/log/suricata/suricata_igb128922: ls -lah
total 45737964
drw-rw----  2 root  wheel   2.0K Dec  7 17:40 .
drwx------  4 root  wheel   512B May 22  2018 ..
-rw-r-----  1 root  wheel   470K Dec  7 17:39 alerts.log
-rw-r--r--  1 root  wheel   501K Dec  6 15:25 alerts.log.2018_1206_1525
-rw-r-----  1 root  wheel   3.7K Sep 26 16:10 block.log
-rw-r-----  1 root  wheel     0B May 22  2018 http.log
-rw-r-----  1 root  wheel   2.9G Dec  7 17:40 stats.log
-rw-r--r--  1 root  wheel   4.4M Dec  7 14:16 stats.log.2018_1207_1415
-rw-r--r--  1 root  wheel   2.8G Dec  7 17:40 stats.log.2018_1207_1420
-rw-r--r--  1 root  wheel   2.8G Dec  7 17:40 stats.log.2018_1207_1425
-rw-r--r--  1 root  wheel   2.8G Dec  7 17:40 stats.log.2018_1207_1430
-rw-r--r--  1 root  wheel   2.8G Dec  7 17:40 stats.log.2018_1207_1435
-rw-r--r--  1 root  wheel   2.3G Dec  7 17:40 stats.log.2018_1207_1440
-rw-r--r--  1 root  wheel   2.1G Dec  7 17:40 stats.log.2018_1207_1445
-rw-r--r--  1 root  wheel   2.0G Dec  7 17:40 stats.log.2018_1207_1450
-rw-r--r--  1 root  wheel   2.0G Dec  7 17:40 stats.log.2018_1207_1455
-rw-r--r--  1 root  wheel   1.9G Dec  7 17:40 stats.log.2018_1207_1500
-rw-r--r--  1 root  wheel   1.7G Dec  7 17:40 stats.log.2018_1207_1505
-rw-r--r--  1 root  wheel   1.6G Dec  7 17:40 stats.log.2018_1207_1510
-rw-r--r--  1 root  wheel   1.6G Dec  7 17:40 stats.log.2018_1207_1515
-rw-r--r--  1 root  wheel   1.6G Dec  7 17:40 stats.log.2018_1207_1520
-rw-r--r--  1 root  wheel   1.3G Dec  7 17:40 stats.log.2018_1207_1525
-rw-r--r--  1 root  wheel   1.3G Dec  7 17:40 stats.log.2018_1207_1530
-rw-r--r--  1 root  wheel   1.3G Dec  7 17:40 stats.log.2018_1207_1535
-rw-r--r--  1 root  wheel   1.0G Dec  7 17:40 stats.log.2018_1207_1540
-rw-r--r--  1 root  wheel   1.0G Dec  7 17:40 stats.log.2018_1207_1545
-rw-r--r--  1 root  wheel   1.0G Dec  7 17:40 stats.log.2018_1207_1550
-rw-r--r--  1 root  wheel   1.0G Dec  7 17:40 stats.log.2018_1207_1555
-rw-r--r--  1 root  wheel   802M Dec  7 17:40 stats.log.2018_1207_1600
-rw-r--r--  1 root  wheel   760M Dec  7 17:40 stats.log.2018_1207_1605
-rw-r--r--  1 root  wheel   897M Dec  7 17:40 stats.log.2018_1207_1610
-rw-r--r--  1 root  wheel   774M Dec  7 17:40 stats.log.2018_1207_1615
-rw-r--r--  1 root  wheel   545M Dec  7 17:40 stats.log.2018_1207_1620
-rw-r--r--  1 root  wheel   522M Dec  7 17:40 stats.log.2018_1207_1625
-rw-r--r--  1 root  wheel   639M Dec  7 17:40 stats.log.2018_1207_1630
-rw-r--r--  1 root  wheel   423M Dec  7 17:40 stats.log.2018_1207_1635
-rw-r--r--  1 root  wheel   558M Dec  7 17:40 stats.log.2018_1207_1640
-rw-r--r--  1 root  wheel   369M Dec  7 17:40 stats.log.2018_1207_1645
-rw-r--r--  1 root  wheel   317M Dec  7 17:40 stats.log.2018_1207_1650
-rw-r--r--  1 root  wheel   266M Dec  7 17:40 stats.log.2018_1207_1655
-rw-r--r--  1 root  wheel   217M Dec  7 17:40 stats.log.2018_1207_1700
-rw-r--r--  1 root  wheel   187M Dec  7 17:40 stats.log.2018_1207_1705
-rw-r--r--  1 root  wheel   146M Dec  7 17:40 stats.log.2018_1207_1710
-rw-r--r--  1 root  wheel   112M Dec  7 17:41 stats.log.2018_1207_1715
-rw-r--r--  1 root  wheel    78M Dec  7 17:41 stats.log.2018_1207_1720
-rw-r--r--  1 root  wheel    65M Dec  7 17:41 stats.log.2018_1207_1725
-rw-r--r--  1 root  wheel    40M Dec  7 17:41 stats.log.2018_1207_1730
-rw-r--r--  1 root  wheel    18M Dec  7 17:41 stats.log.2018_1207_1735
-rw-r--r--  1 root  wheel   1.0M Dec  7 17:41 stats.log.2018_1207_1740
-rw-r--r--  1 root  wheel   4.8M Dec  7 17:04 suricata.log
Log files are configured with limits:
What should I check? Why are they getting out of control? Thanks!
-
What version of the package are you running? I think I fixed problems with log size maintenance in the 4.0.13_8 or 4.0.13_9 version. The current version is 4.0.13_11.
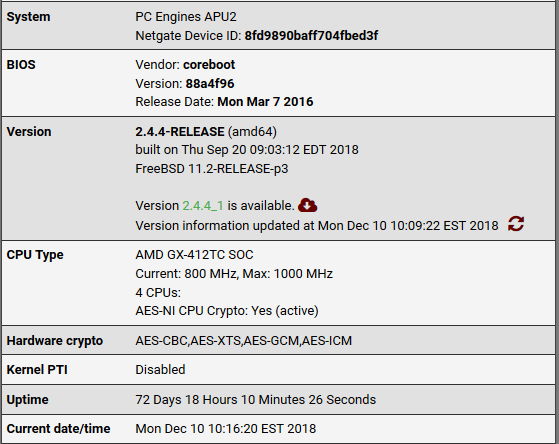
That screen shot does not look like a current version of pfSense. If you are not on a current pfSense version (as in 2.4.x), then you won't be able to update the Suricata package due to PHP version dependencies.
Are you running some custom skin on a current pfSense version that makes it appear like the older pre-Bootstrap GUI?
-
@bmeeks
Custom skin.pfSense Version 2.4.4
Package Version 4.0.13_8Looks like I should update. It's only been in less than 3 months. Didn't think it would need an update to fix something but I'll give it a go.

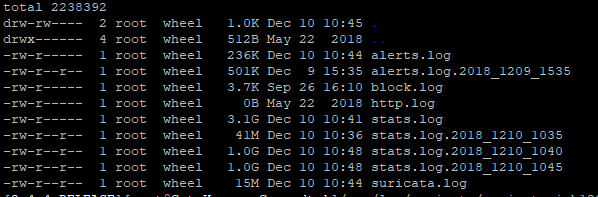
I completely wiped and reset them but they are growing again:
-
The code fix in the latest posted package version (4.0.13_11) should result in the logs being maintained at the sizes set on the LOG MGMT tab.
-
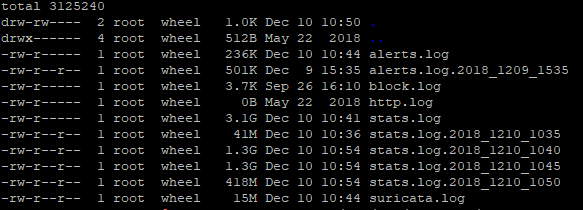
I've updated it at about 10:37am and the log files have changed but I don't think it helped.

and a few minutes later
-
See older thread https://forum.netgate.com/topic/130980/suricata-not-limiting-log-sizes-by-default ...from my understanding back then, even though log rotation is showing as on by default, one has to save the log rotation page for it to take effect. So that should be a quick fix in lieu of upgrading the package.
-
@stewart said in Huge Suricata Stats Logs:
I've updated it at about 10:37am and the log files have changed but I don't think it helped.
and a few minutes later
The cron task executes on an interval of, I believe, 5 minutes. I would have to dig back through the code to be sure, but at any rate the file monitoring is a snapshot in time (in this case, every 5 minutes). So the file sizes can grow beyond the set limits by a little bit depending on how rapidly data is added to them. I would not expect them to grow as big as yours, though. The stats are collected and logged every 8 seconds according to the Suricata docs. I really do not understand why your files are so huge so quickly. What is in those files? It should just be some lines of texts showing packet stats (number passed, number dropped, etc.).
-
I just found some information via a Google search that indicates the Suricata processes will need to be sent a SIGHUP signal when the log files are rotated. That is not currently being done in the GUI package's logrotate code. I will submit a fix soon to take care of this.
What's happening in your case is the Suricata process is continuing to write to the rotated file via the previously opened file handle. Look at the file write timestamps in your posted images to see what I mean.
I've created a Redmine bug report (#9188) to track this issue.
-
@bmeeks That's what I would expect, but instead I get:

I can't tail or head it. It just sits there. So I copied off the log file and nano'ed it.
I just checked and it is better. Color me confused...
-
@stewart said in Huge Suricata Stats Logs:
@bmeeks That's what I would expect, but instead I get:
I can't tail or head it. It just sits there. So I copied off the log file and nano'ed it.
I just checked and it is better. Color me confused...
I have a fixed file ready if you are willing to test it for me. If you are, send me a PM (chat message).
You might also consider increasing the stats collection interval for your setup. That's on the INTERFACE SETTINGS tab where you enable stats log generation. The default interval is 10 seconds. You could try increasing that to 60 seconds (or even a little more) to see if that helps control the rapid growth of the stats.log file.
-
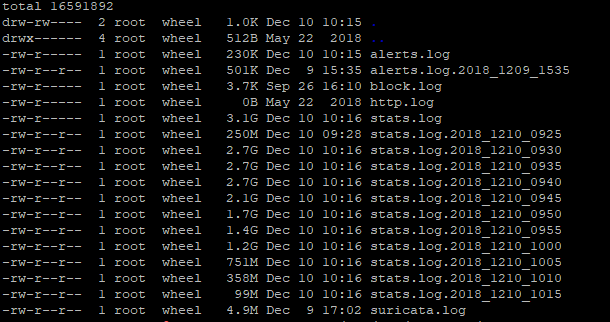
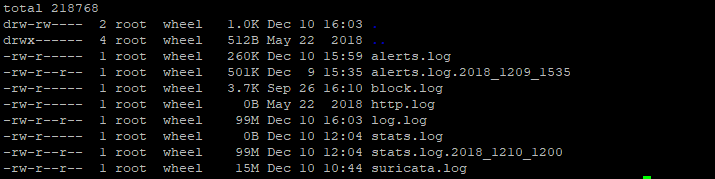
@bmeeks I've been out the last couple of days. Here is what it shows today:
Numbers are looking low, which is nice. I don't really need the stats, just good to have a little back history for what's going on. Stats at 99M is fine but isn't the 500k. Neither really bother me. No idea how to go back and look at them, though, if it's not human readable.
I'll shoot you a PM if you still want me to test anything. Let me know.
-
@stewart said in Huge Suricata Stats Logs:
@bmeeks I've been out the last couple of days. Here is what it shows today:
Numbers are looking low, which is nice. I don't really need the stats, just good to have a little back history for what's going on. Stats at 99M is fine but isn't the 500k. Neither really bother me. No idea how to go back and look at them, though, if it's not human readable.
I'll shoot you a PM if you still want me to test anything. Let me know.
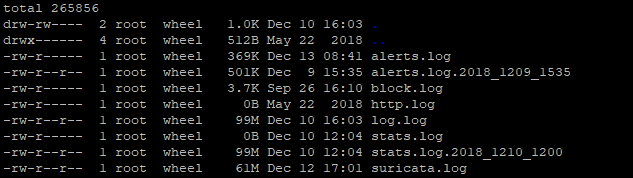
It might take issuing the SIGHUP to stop the stats.log from getting too far past the limit. 99 MB is way past 0.5 MB. The only thing I can imagine is the log is not actually getting rotated until the next rules update. Suricata is restarted each time the rules update, and that would release the old log and start a new one. The SIGHUP I am putting in the next update will do the same thing, but at log rotation time.
Edit: correct typo
-
@Stewart are there entries in the system log every five minutes indicating Suricata is trying to rotate the logs? I ran into something this week where that was happening. I was trying to troubleshoot something else at the time, and knew I was going to upgrade to 2.4.4(_1), so didn't really look into it (sorry). I checked the box at the top of the Suricata log settings page to delete the logs when the package was deleted, and uninstalled. This was on a SG-3100. I'm wondering now if that is what you are seeing. My vague recollection is the filenames shown were like every week or whatever, implying something wasn't working with the rotation (i.e. it was not actually rotating them every 5 minutes), but like I said I didn't look into it.
-
@teamits said in Huge Suricata Stats Logs:
@Stewart are there entries in the system log every five minutes indicating Suricata is trying to rotate the logs? I ran into something this week where that was happening. I was trying to troubleshoot something else at the time, and knew I was going to upgrade to 2.4.4(_1), so didn't really look into it (sorry). I checked the box at the top of the Suricata log settings page to delete the logs when the package was deleted, and uninstalled. This was on a SG-3100. I'm wondering now if that is what you are seeing. My vague recollection is the filenames shown were like every week or whatever, implying something wasn't working with the rotation (i.e. it was not actually rotating them every 5 minutes), but like I said I didn't look into it.
This is what I suspect. The PHP code in the package is rotating out the logs, but it can't really do anything with the open file handles. My suspicion is the Suricata binary is continuing to write to the old file handle and thus the log grows. The next time Suricata is stopped and restarted, things get fixed as Suricata opens a new file handle. Suricata is restarted at the end of each rules update cycle. You set that interval on the GLOBAL SETTINGS tab.
I have the new code for sending the SIGHUP signal to running Suricata processes after the log rotation. That should fix this problem. However, I just started working on updating Suricata to the new 4.1.0 binary. So I will hold off and put this log rotation fix into the 4.1.0 update. If that update runs into some major issue that will hold it up, then I will port the fix into the current Suricata version.
-
@bmeeks said in Huge Suricata Stats Logs:
Suricata is restarted at the end of each rules update cycle. You set that interval on the GLOBAL SETTINGS tab.
Hmm, maybe that's the part that wasn't working right. I'm sure I would have set it to a daily update. Unfortunately I had to reload this router from USB stick...it seems the update half installed or something and it lost connectivity. I'm pretty sure that reformats, so no logs to view now.
-
@bmeeks Then I'll just wait. We just started rolling out the 2.4.4 updates to our managed routers when 2.4.4_1 came out. We're holding off on upgrading to it until we finish testing in our office (after the first of the year). Maybe by that time you'll have the 4.1.0 update out and we can just roll with that. Thanks!