Advice needed - way to give rule descriptions to syslog server
-
Given that
- I would like to use firewall rule descriptions to make reports or alerts
- Since pfsense firewall rule numbers may vary over time, I cannot just create a simple lookup where I assemble the report
How would you suggest I get the rule descriptions to my syslog server, appended to every matching log line? Or, do you suggest a different method (without using pfsense GUI) to evaluate the logging?
Thanks for your help.
-
Anything? Does anybody use their firewall logs - how?
-
You could enable remote logging and send syslog to Logstash running somewhere. It looks like the Translate filter plugin is what you're looking for:
https://www.elastic.co/guide/en/logstash/current/plugins-filters-translate.html
-
Thanks for responding. It's true, Logstash is a great place to search the logs. I use Splunk, which also works.
However, the issue is that the syslog recorded by pfSense doesn't include any rule identifier other than the "rule number." And, these rule numbers may change. Most of the time I can customize my firewall syslog output to include a "rule description." This helps when searching the logs, because I could describe some rules as more serious than others. Instead, I have to use Splunk or Logstash to "interpret" the severity of every log entry. Also, it makes it harder to trace - why am I seeing these logs? which rule triggered?
Can anybody suggest a way to modify pfSense so the rule description is included in the syslog output?
Thanks again.
-
What about the rule's "tracking id'? You would still have to have to use something like Logstash to match the tracking ids to descriptions though.
Your post got me curious so I tried it out.
I created a CSV file from this one-liner and used the Logstash Translate filter plugin to map tracking id's to descriptions. As long as the fw rules are fairly stable, it's no too much of a pain.
pfctl -vv -sr | grep USER_RULE | sed 's/[^(]*(\([^)]*\).*"USER_RULE: *\([^"]*\).*/"\1",\2/' | sort -t ' ' -k 1,1 -uHere's a screenshot from Elasticsearch alerting on my country blocking rule. Logstash added the description field.
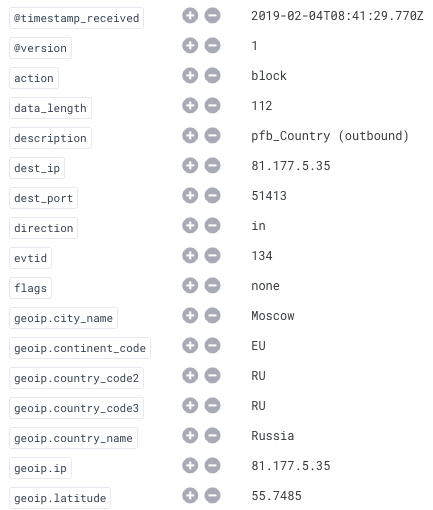
note: credit for the sed command goes to this guy on SO.