Status: Monitoring is completely broken, pfSense 2.4.5
-
Since at least 2.4.4-pX and now with 2.4.5, Status: Monitoring is not working for me.
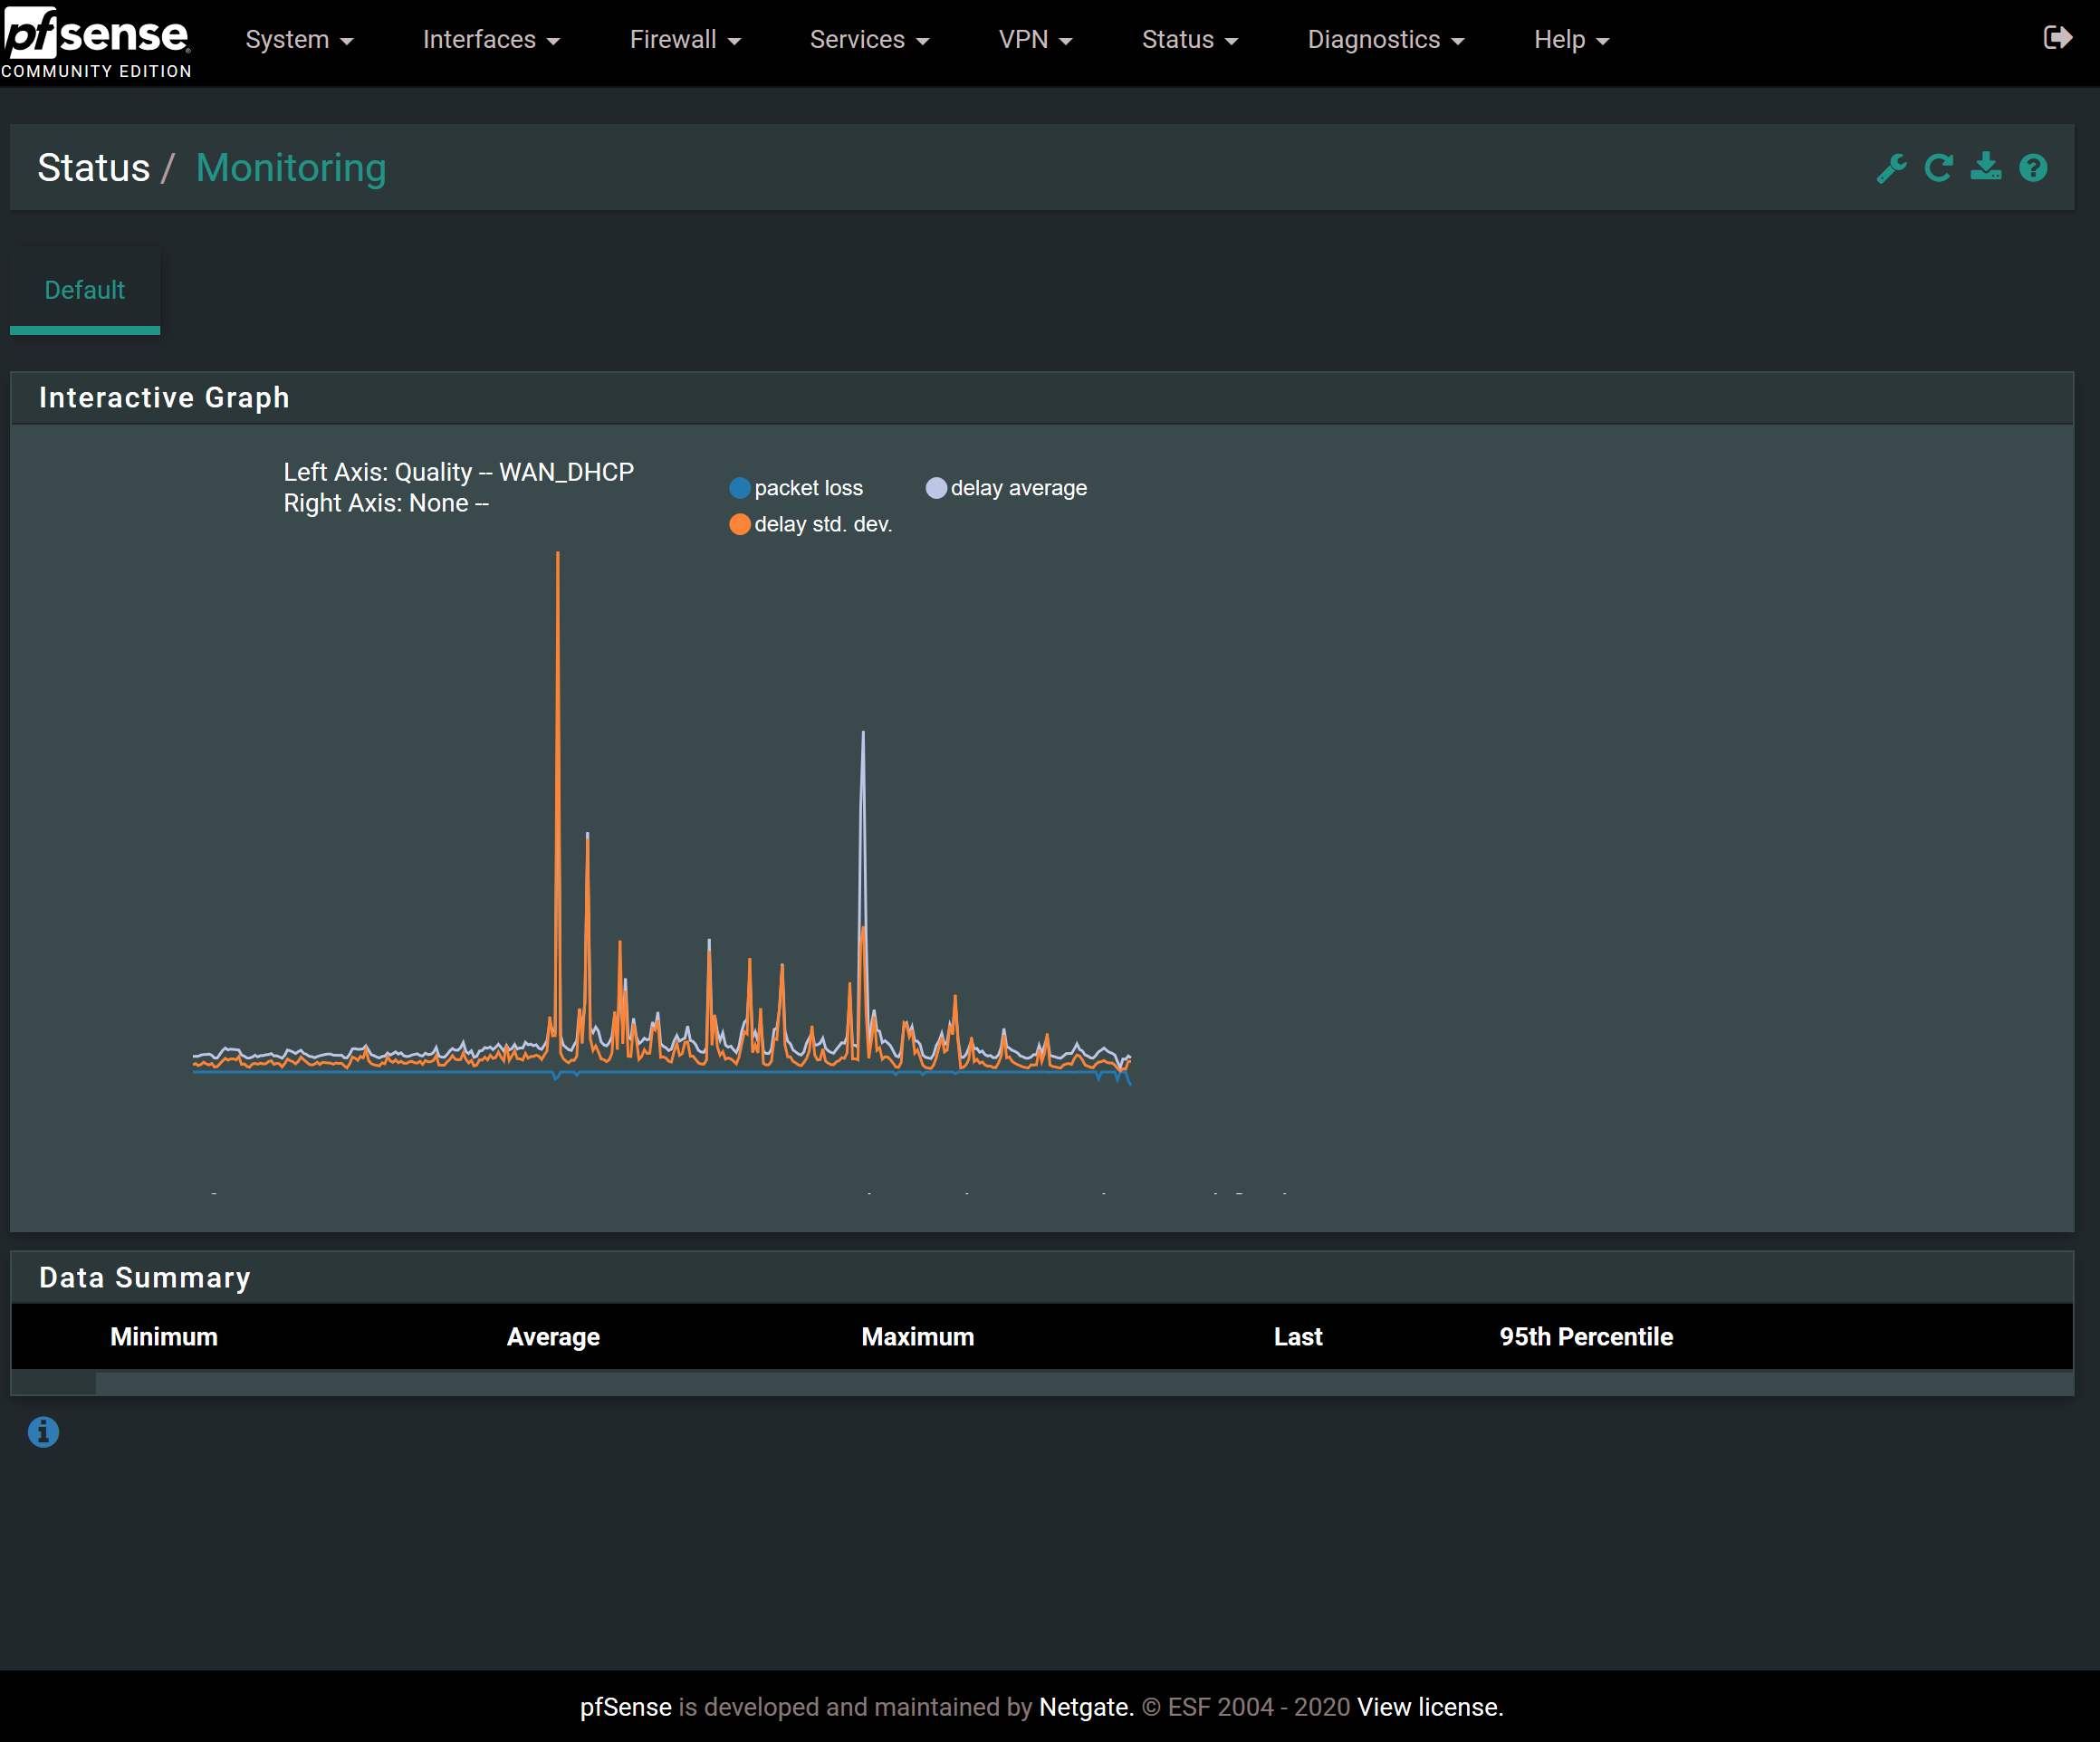
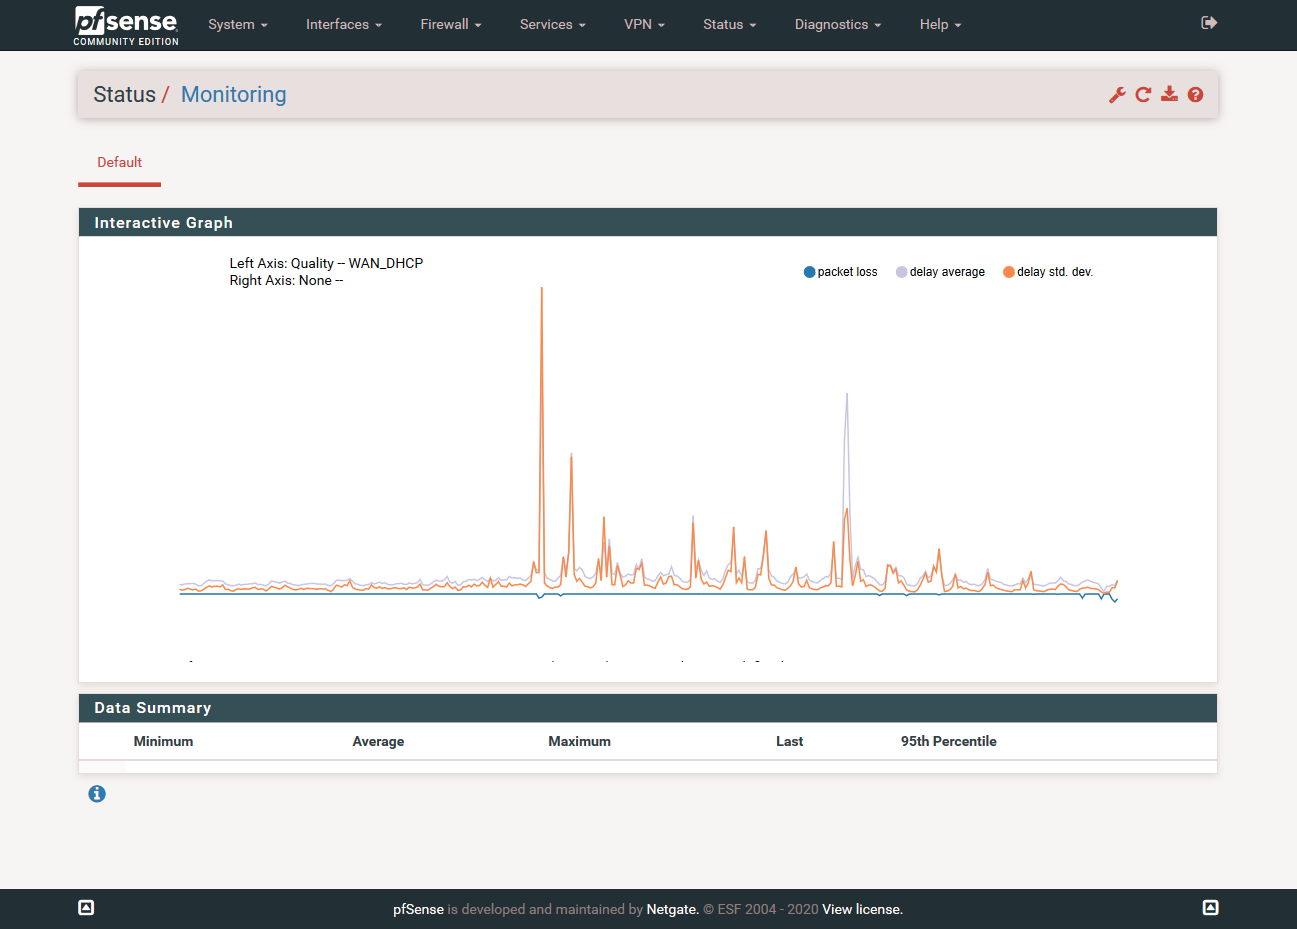
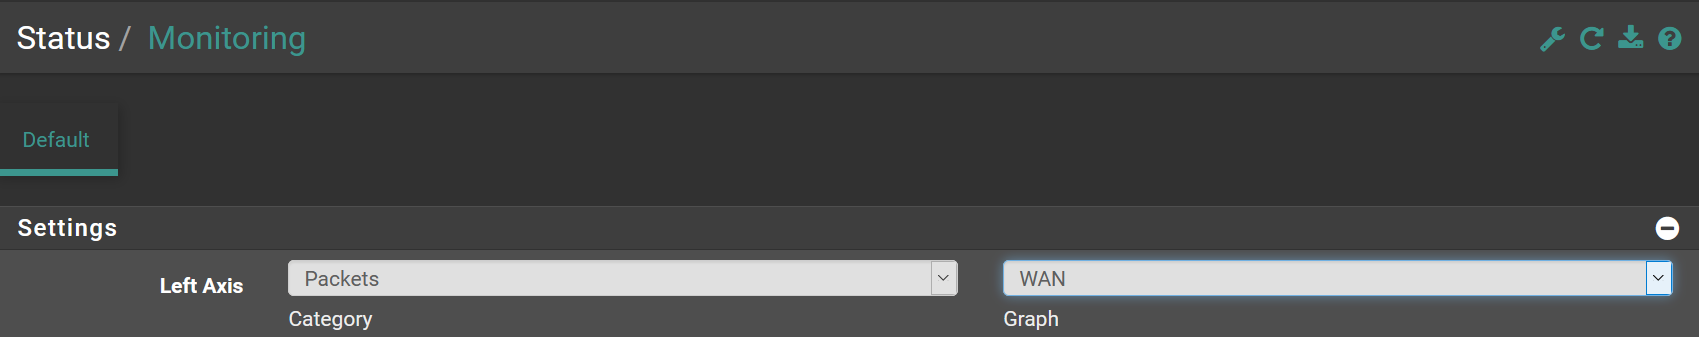
What I see when I first open the Monitoring page.

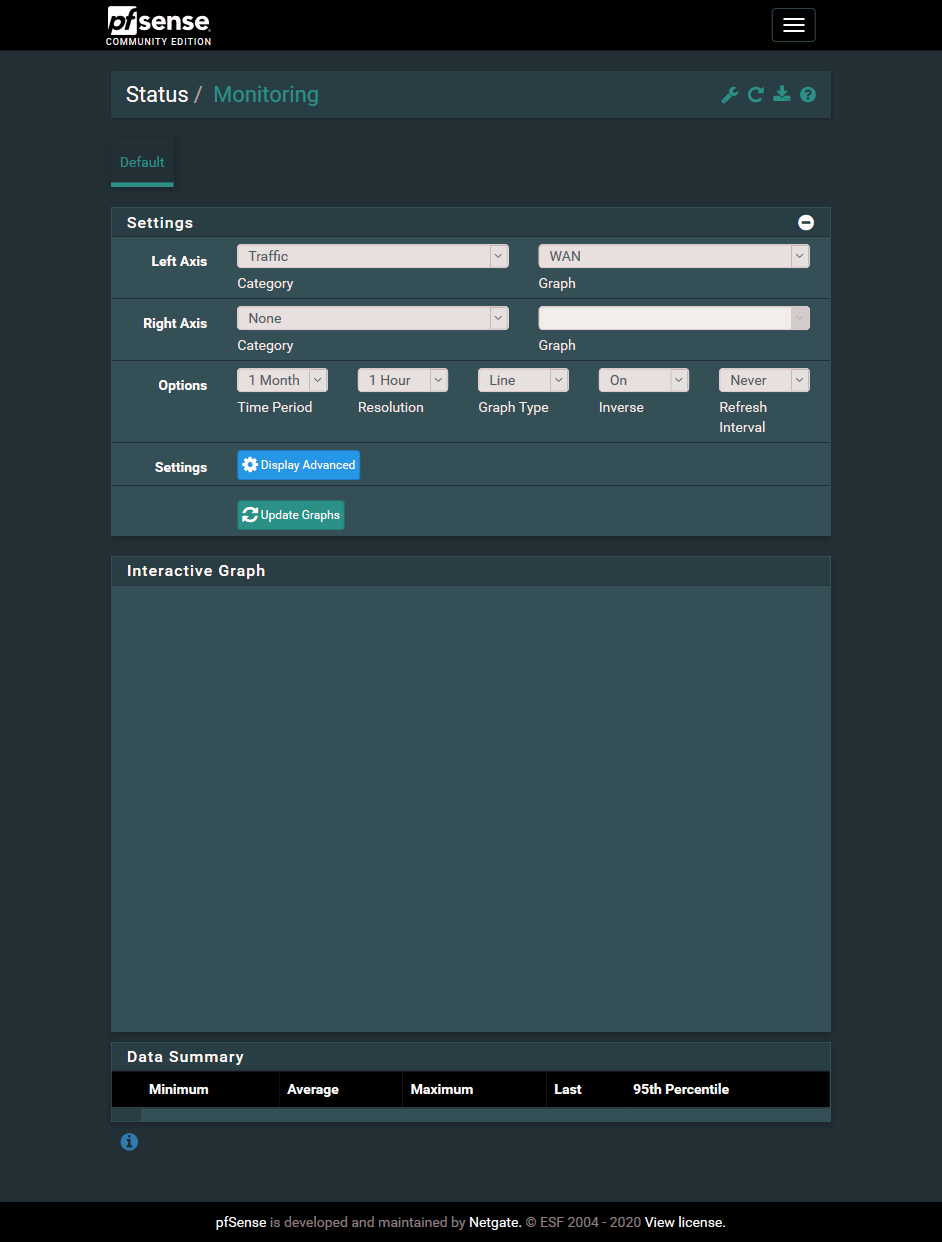
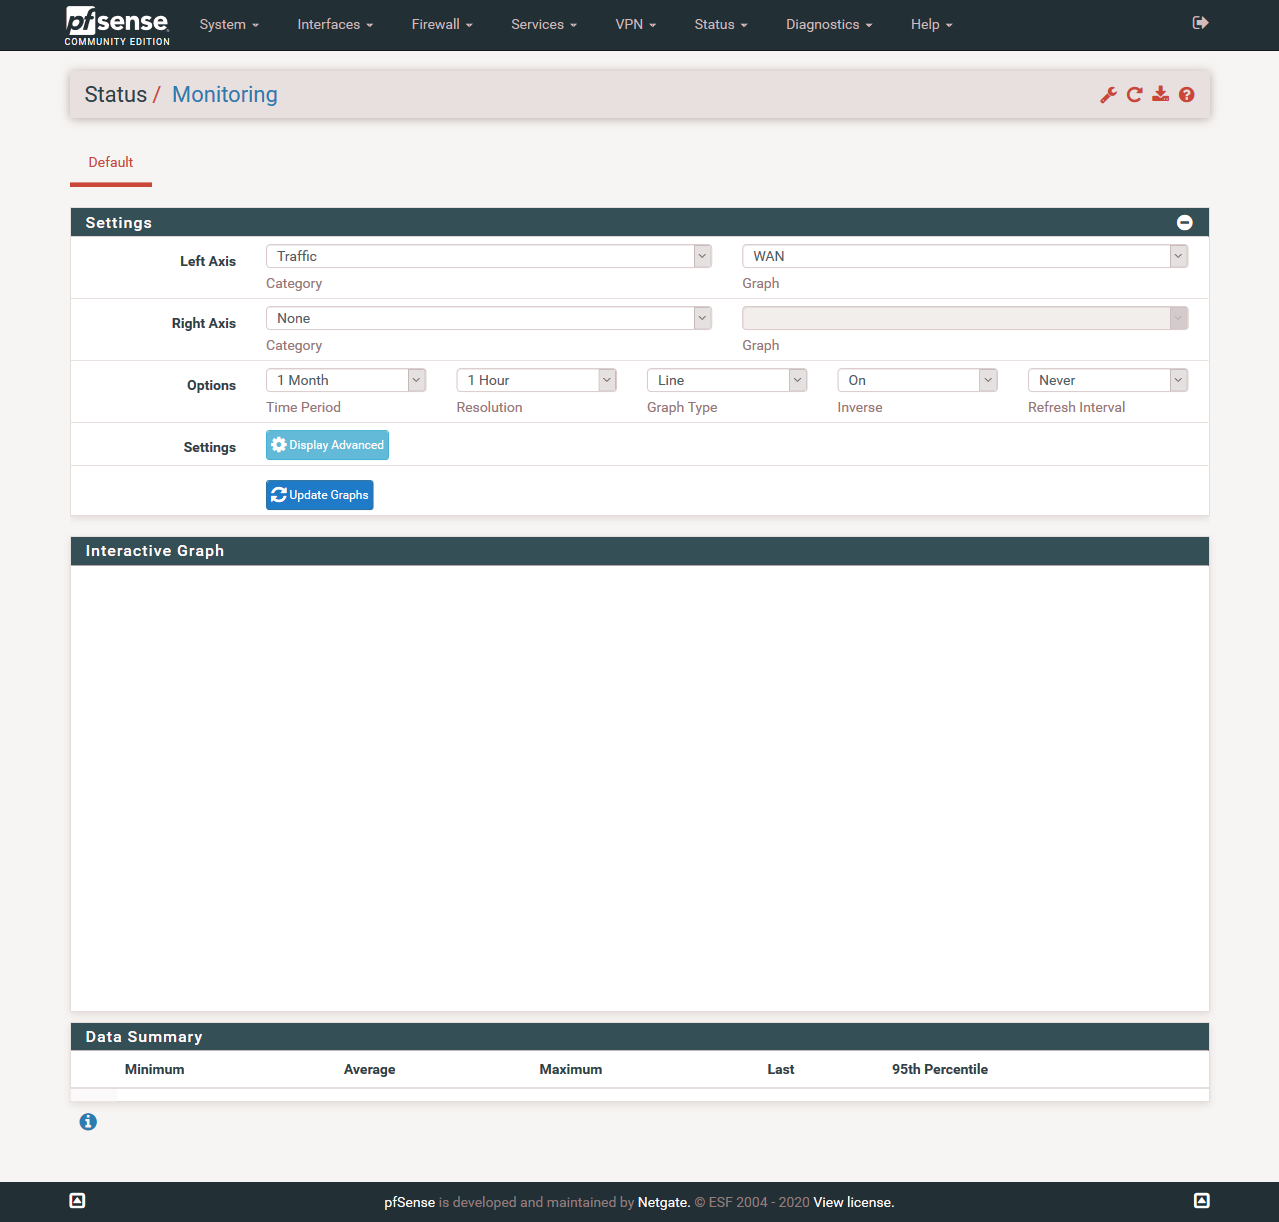
What I see if I try to change some of the settings to show something different. It doesn't seem to matter what metric I change it to or what timeframe I select, I can only see this blank page.
A long time ago I might have tried changing the RRD settings to retain more data points or something. Not sure, hard to remember. I went looking for such a setting today and am not able to find it. If it was previously possible to change those settings, maybe that is something different in my config that would explain why no one else on the forums seems to have this issue, as indicated by a search.
-
@scurrier Perhaps a browser problem? I've had no issues on any 2.4.x or 2.5-Dev. Try another browser?
-
@provels Good idea, but I tried the latest Chrome, Firefox, Edge, and Internet Explorer and they all have the exact same issue.
-
Might be your theme.
-
Yeah what theme is that, and what are you viewing on - phone/tablet? PC?
-
@jimp said in Status: Monitoring is completely broken, pfSense 2.4.5:
Might be your theme.
Changed the theme from pfSense-dark to pfSense. No dice.
@johnpoz said in Status: Monitoring is completely broken, pfSense 2.4.5:
Yeah what theme is that, and what are you viewing on - phone/tablet? PC?
It was pfSense-dark and I changed it now to pfSense. I'm viewing on a 15" 4k laptop. But last I checked the problem also existed on mobile, a Pixel 3 in Firefox.
-
If you open the browser console are there any errors there?
It's odd that it shows graph data but nothing in the box below... Almost has to be some kind of JavaScript issue, script blocking/ad blocking kind of thing if it's not the theme.
-
@jimp Good idea, I need to remember to add this to my standard first line troubleshooting.
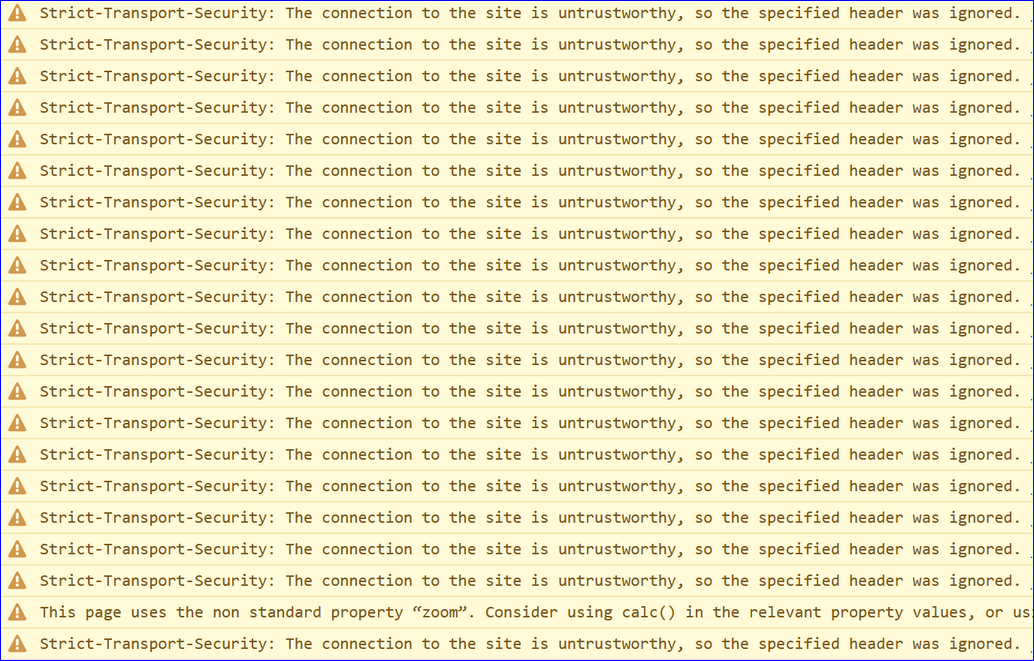
Console shows this.
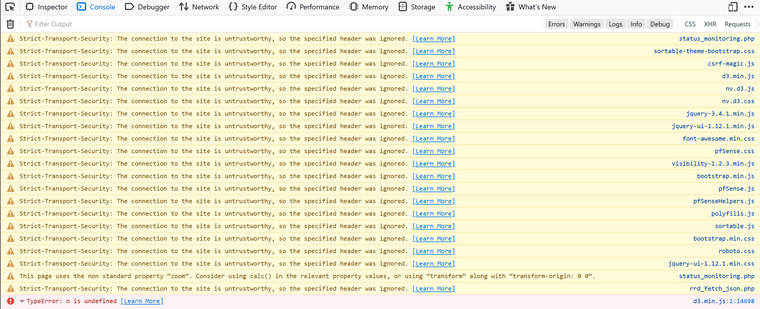
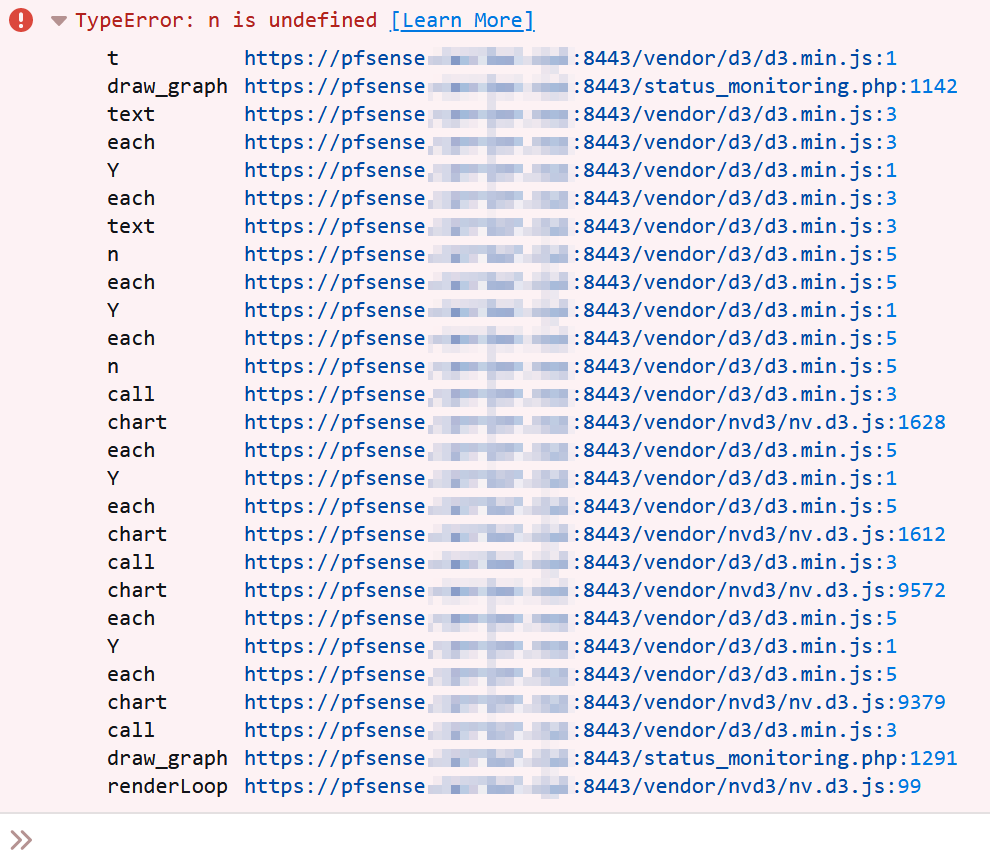
Here's an expansion of the last one in red.
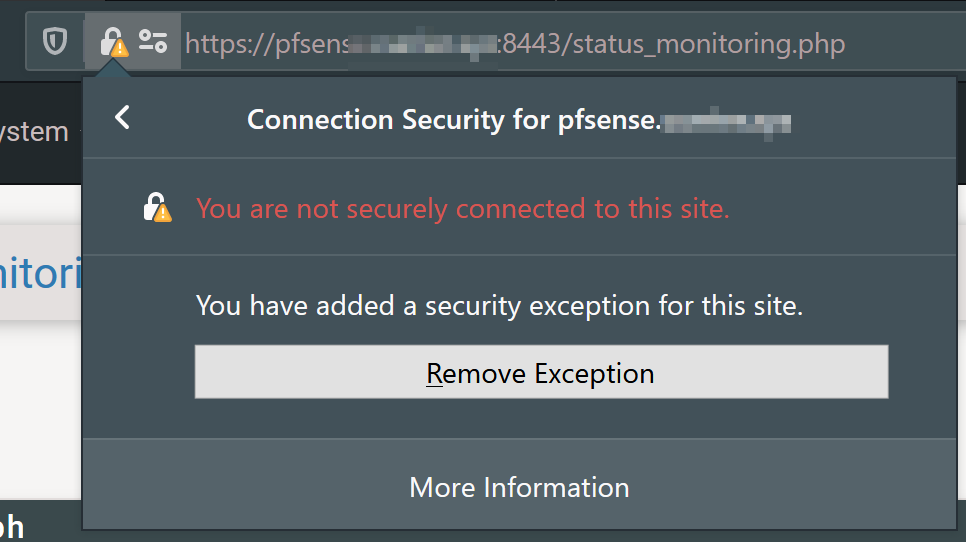
Some of those errors reminded me that I do have a security exception set up in Firefox. I have my own CA set up and pfSense has a cert from that CA. THe cert was made in 2015 and I never updated it when the Subject Alternate Name requirements came along, which I think is why I had made the exception. Regardless, none of the rest of pfSense has an issue with this and I'd think the exception should prevent the cert from causing problems on the page but I mention it in case someone knows more than me and it's relevant.
-
That isn't likely related. Though that last line with the TypeError seems more like a lead. I don't see that on mine which are working.
-
Are there any errors in the pfSense system log when you try to access that page?
Are you logging in as admin or another user?
-
@jimp I forgot to include the console output upon trying to update the graph. Here it is, nothing interesting to my eye.

Literally nothing happens in the System > General logs when I initially open the page and then try to update the graph.
I am logged in as the base admin account.
-
Anything else I could try?
-
@scurrier said in Status: Monitoring is completely broken, pfSense 2.4.5:
Anything else I could try?
I would suggest studying up on HSTS here: https://developer.mozilla.org/en-US/docs/Web/HTTP/Headers/Strict-Transport-Security, and then checking to see how this setting ties in with your setup. If Status Monitoring itself was broken in pfSense, there would be a ton of posts here about the issue. The fact there is not indicates your issue is very likely a local one. Perhaps it is being caused by the CA differences you mentioned? That's where I would be looking. The HSTS message will prevent certain things from loading in the browser, so that will break Status Monitoring for sure.
-
@scurrier : check System > Routing > Gateways
IS WAN really WAN (an old interface name ?) and now called WAN_DHCP ? (example) ?
What are the gateway names ?
Is monitoring activated for them ?edit :
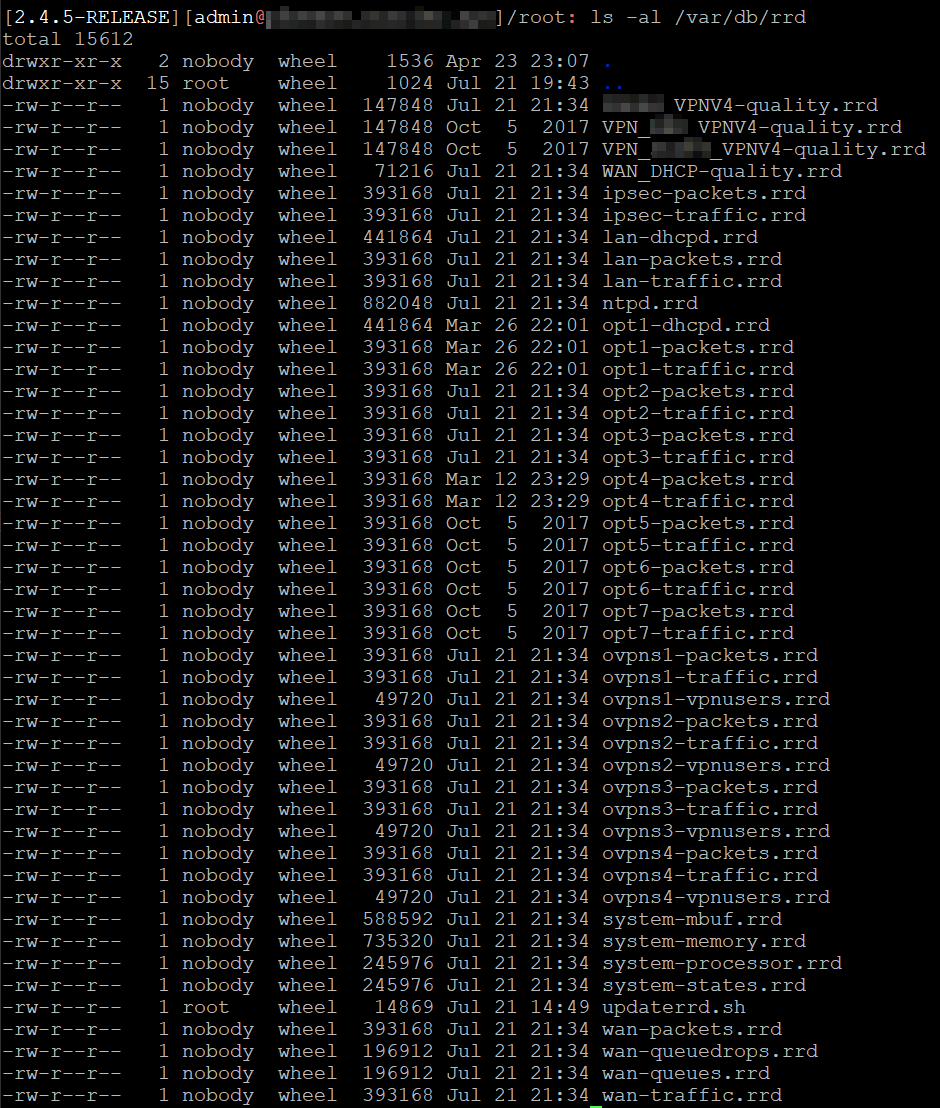
ls -al /var/db/rrdold, abandoned rrd files (== abandoned interface names) might exist.
-
Coming back to this issue since I am wanting to see just how unreliable my ISP has been since COVID-19 and I want to use the quality graphs to do it.
Regarding the security warning I mentioned earlier, that was just because I was accessing the web gui using a host name that I didn't put in the certificate. I tried using the IP I put in the certificate Common Name and now the browser fully accepts it:
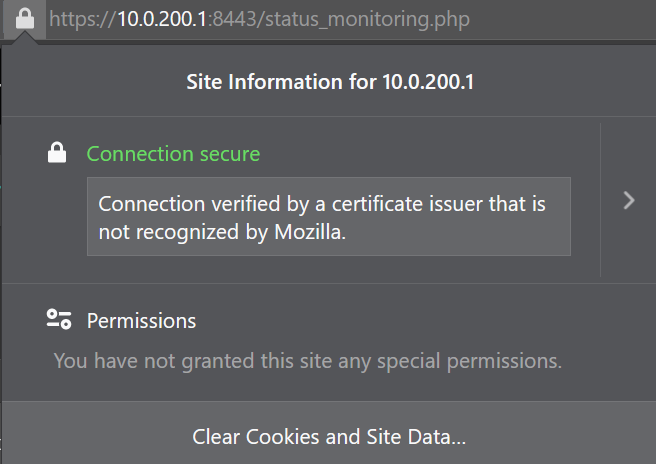
...yet, the problem persists.
@Gertjan said in Status: Monitoring is completely broken, pfSense 2.4.5:
@scurrier : check System > Routing > Gateways
IS WAN really WAN (an old interface name ?) and now called WAN_DHCP ? (example) ?
What are the gateway names ?
Is monitoring activated for them ?edit :
ls -al /var/db/rrdold, abandoned rrd files (== abandoned interface names) might exist.
Thanks for your post. Sorry I somehow missed it earlier. To answer your questions:
Here's the WAN gateway:
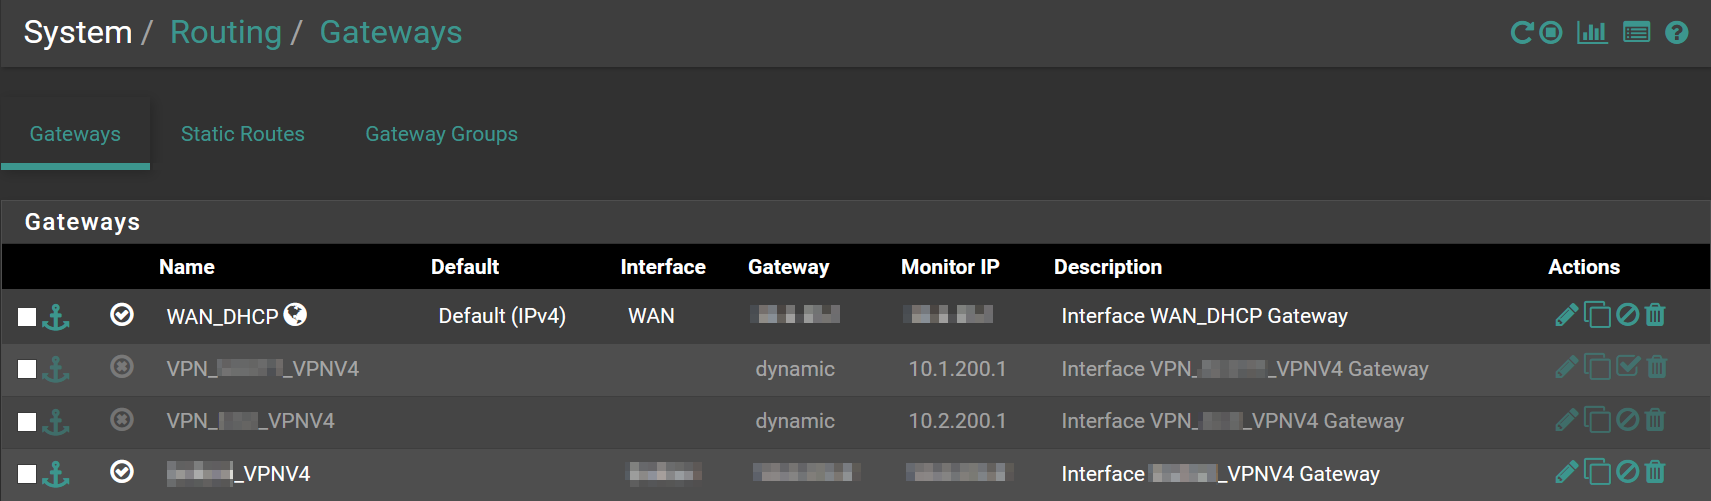
When I have the Category of the Monitoring set to Packets or Traffic, I see WAN in the Graph dropdown. When I change the Category to Quality, I see WAN_DHCP. I guess that's because some Categories deal with Gateways and others deal with Interfaces. My WAN_DHCP gateway is on the WAN interface. Seems OK to me.

Here's my RRD files.
-
Oh, snap. Looks like this bug #7656 is exactly what I'm encountering. The line numbers are different, but for me line 1142 of status_monitoring.php involving the same variables the bug discusses and they appear to be the culprit for me.
I don't know JavaScript or how to debug it in a browser, but I can fiddle with the best of 'em.
I set a breakpoint on 1141 of status_monitoring.php. This shows that
timeFormatis undefined.
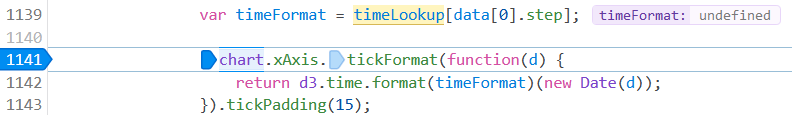
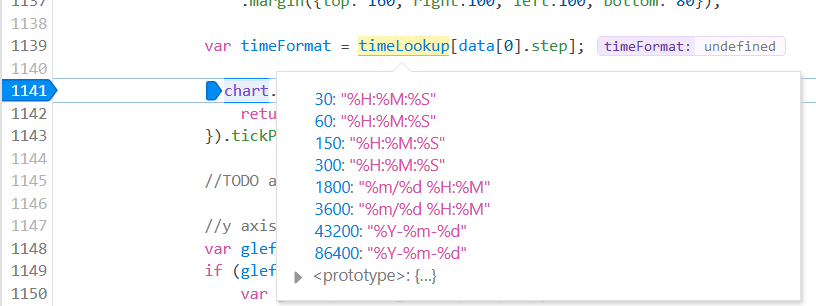
The reason
timeFormatis undefined appears to be thatdata[0].stepis7200...
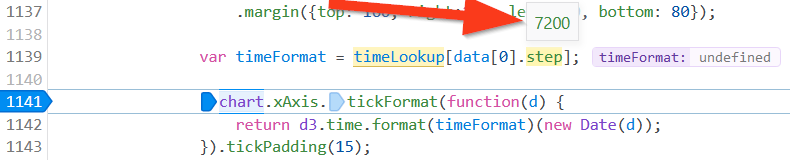
...yettimeLookupdoes not contain this value:
So... yada, yada, yada, this causes my problem?
-
@scurrier said in Status: Monitoring is completely broken, pfSense 2.4.5:
The line numbers are different
That code is very ancient.
What about hitting Ctrl-F5 to force-flush the browser cache - or even flush the cash, or use another browser to reproduce. -
@Gertjan I just confirmed that Ctrl + F5 does not solve the issue.
I've previously tried other browsers, no luck. It's a bug.
-
Were you using HTHS in the past (the browser you are using thinks so !) ? If so, the browser will recall that, and refuse new, non HSTS certificate. Which means that js files won't get loaded -> I'm reading out loud the messages from your logs - , which means functions and variables are not defined. That's what your issue is all about.
Ctrl-F5 will not wipe browser's SHTS memory. To wipe that one : go Google.

I known that IP's can be put into the SAN of a cert (some cert authorities are refusing that).
IMHO : bad practice. With upcoming IPv6 some what totally not manageable anyway.What happens when you use a 'real' certificate, one that is signed by a known CA ?
Letsencrypt gives them for free this week !Another thing to check : all pfSense files are actually updated, upgraded ?
A clean install could eliminate this question. -
I would just set pfsense to not do https, hit via just plain jane http... Clear all the hsts stuff from your browser... Do you have issues now?
Crazy shit is going to happen if your js are not loading..
this takes all your certs and exceptions and non san in your certs out of the equation... I run my own ca on pfsense and create my own certs.. But It just seems problematic to do hsts on web gui that is only accessible by me, from my own secure network.. Currently its enabled, since I didn't check the box... But if your having issues loading stuff and your seeing errors about strict-transport-security... Then take that out of the equation for "testing".