Netgate Discussion Forum
    • Categories
    • Recent
    • Tags
    • Popular
    • Users
    • Search
    • Register
    • Login

    Traffic Totals Hourly Report Problem

    Scheduled Pinned Locked Moved Traffic Monitoring
    46 Posts 10 Posters 13.0k Views
    Loading More Posts
    • Oldest to Newest
    • Newest to Oldest
    • Most Votes
    Reply
    • Reply as topic
    Log in to reply
    This topic has been deleted. Only users with topic management privileges can see it.
    • P
      pwnell
      last edited by

      This post is deleted!
      1 Reply Last reply Reply Quote 0
      • P
        pwnell
        last edited by pwnell

        I think the issue is with:

        var date = Date.UTC(value.date.year, value.date.month-1, value.date.day, value.id);
        

        The Date.UTC() call expects an hour value for the fourth parameter, however value.id is not the hour, it should be

        var date = Date.UTC(value.date.year, value.date.month-1, value.date.day, value.time.hour);
        
        H 1 Reply Last reply Reply Quote 2
        • Y
          YannTKO
          last edited by

          Thank you for your answer.
          I think you are right because I have 18 interfaces that I can choose in the graphic's settings.
          If I count, in my last capture, the number of lines with between the data (I choose WAN in the settings), I have 17 empty lines.

          Yann

          Netgate SG-3100 23.09.1
          Unifi UAP: 1x FlexHD + 2x nanoHD + 1x AC-IW | Unifi USW: 1x16-PoE Gen2 + 4x US-8-60W | Cloudkey Gen2 Plus
          1 x NUC8i7BEH 32Go - ESXI 8 (Pfsense + many VM)

          1 Reply Last reply Reply Quote 0
          • Y
            YannTKO
            last edited by

            I made de modification in status_traffic_totals.php
            It's good now.
            I think this issue came with 2.4.5. Everything was OK with 2.4.4

            Thank you very much.

            Capture d’écran 2.jpg

            Yann.

            Netgate SG-3100 23.09.1
            Unifi UAP: 1x FlexHD + 2x nanoHD + 1x AC-IW | Unifi USW: 1x16-PoE Gen2 + 4x US-8-60W | Cloudkey Gen2 Plus
            1 x NUC8i7BEH 32Go - ESXI 8 (Pfsense + many VM)

            1 Reply Last reply Reply Quote 0
            • P
              pwnell
              last edited by

              2.4.4 used vnstat 1.5, and 2.4.5 uses vnstat 2.4 which is very different so that would explain it.

              1 Reply Last reply Reply Quote 0
              • Y
                YannTKO
                last edited by

                I have also in my homelab a 2.5 pfsense with the same issue.

                Netgate SG-3100 23.09.1
                Unifi UAP: 1x FlexHD + 2x nanoHD + 1x AC-IW | Unifi USW: 1x16-PoE Gen2 + 4x US-8-60W | Cloudkey Gen2 Plus
                1 x NUC8i7BEH 32Go - ESXI 8 (Pfsense + many VM)

                1 Reply Last reply Reply Quote 0
                • Y
                  YannTKO
                  last edited by YannTKO

                  There is another issue in the Top 10 days view.
                  The x-axis is wrong and no data shown with the mouse.
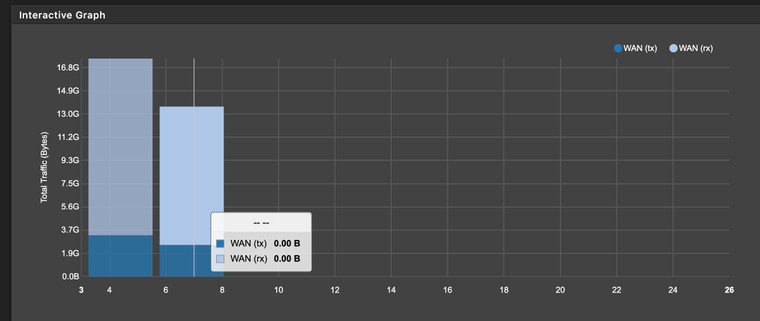
                  Capture d’écran 4.jpg
                  Yann

                  Netgate SG-3100 23.09.1
                  Unifi UAP: 1x FlexHD + 2x nanoHD + 1x AC-IW | Unifi USW: 1x16-PoE Gen2 + 4x US-8-60W | Cloudkey Gen2 Plus
                  1 x NUC8i7BEH 32Go - ESXI 8 (Pfsense + many VM)

                  1 Reply Last reply Reply Quote 0
                  • P
                    pwnell
                    last edited by

                    I see it too. If I have time I'll see if I can figure out why.

                    1 Reply Last reply Reply Quote 0
                    • Y
                      YannTKO
                      last edited by YannTKO

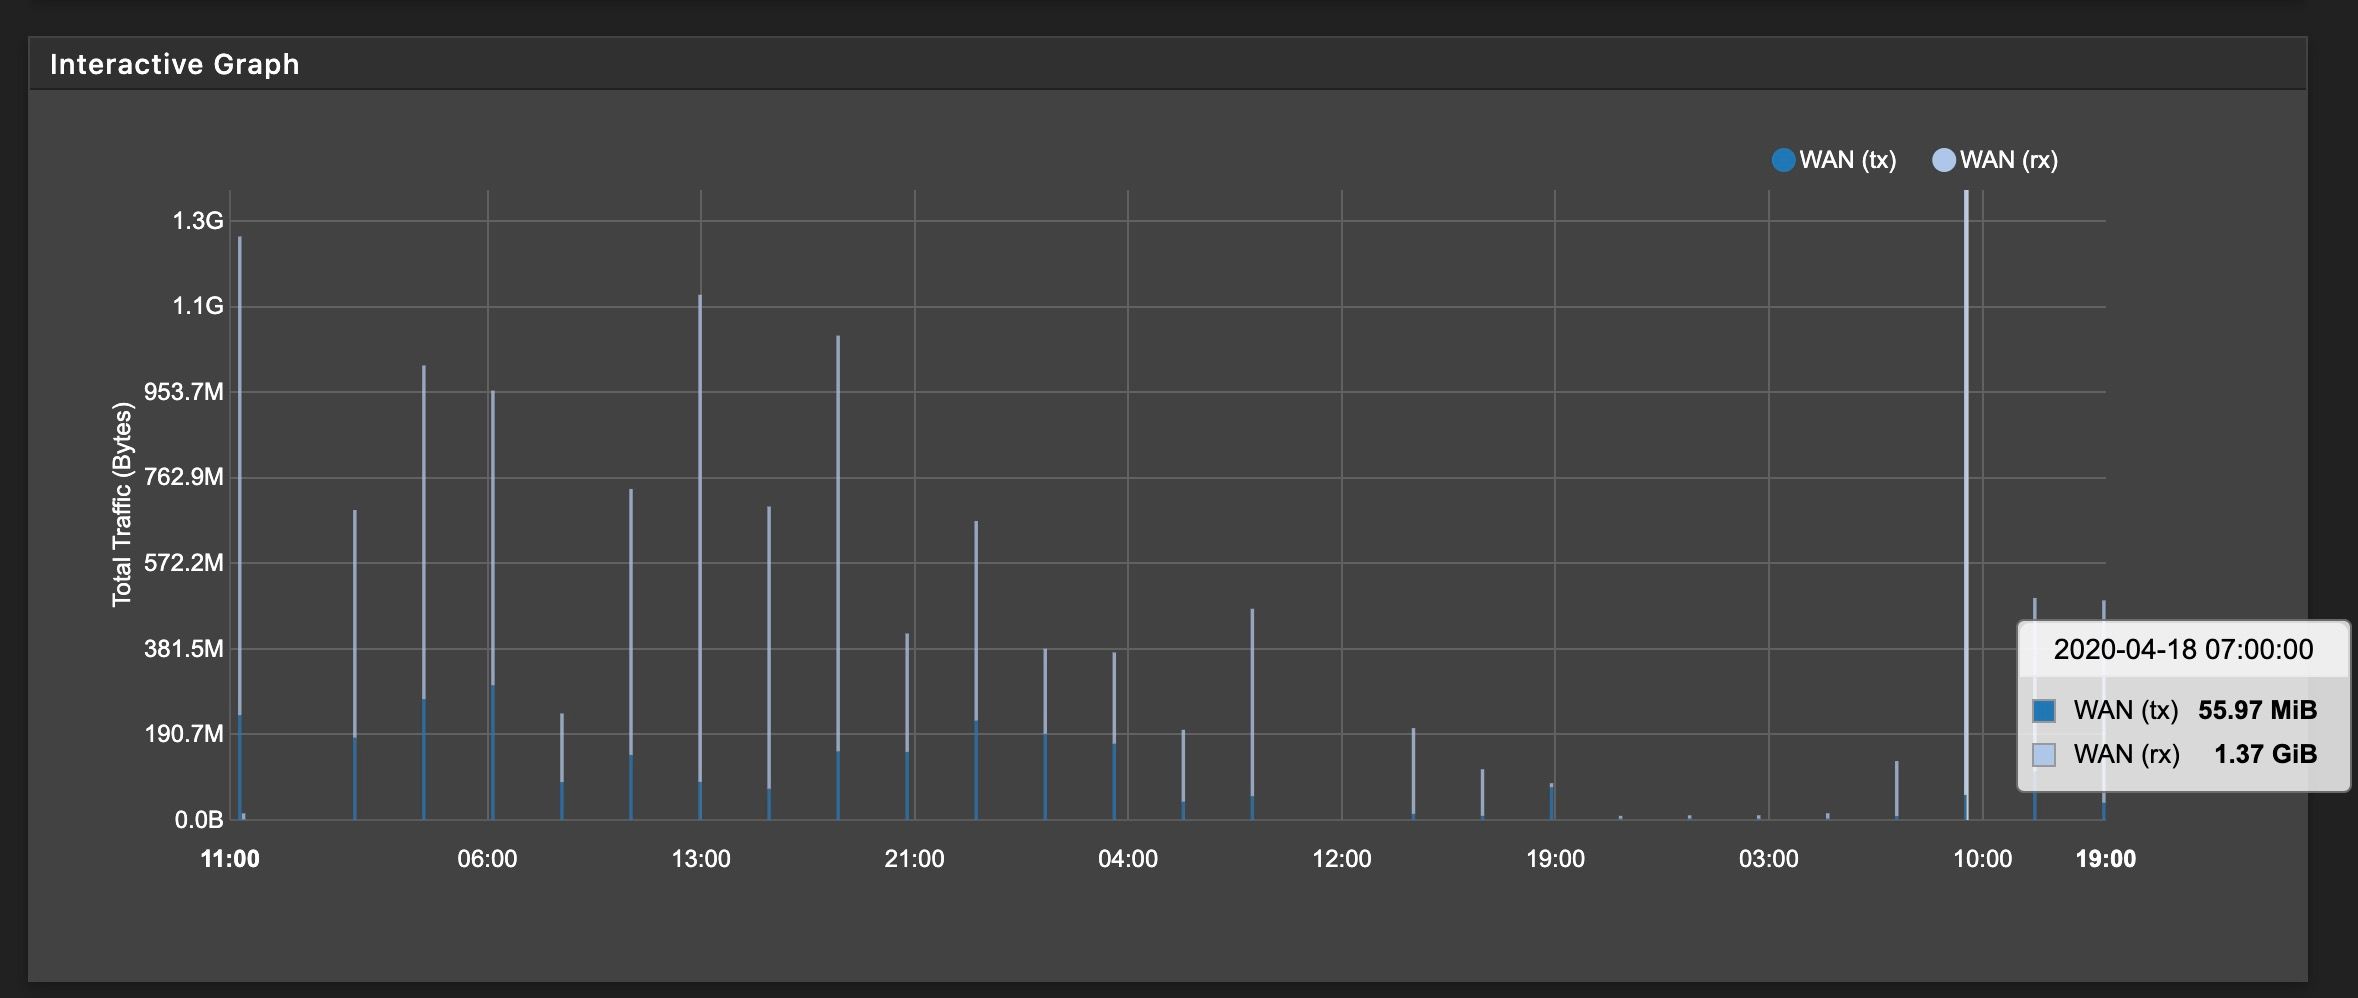
                      IMHO, we only should see 24h in the hourly view and not 2 days.

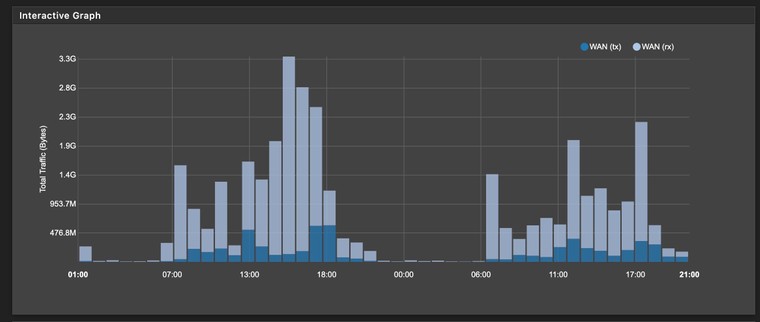
                      EDIT: I disabled/enabled graphing. It solved the problem (the graphic shows only 24h now).

                      Netgate SG-3100 23.09.1
                      Unifi UAP: 1x FlexHD + 2x nanoHD + 1x AC-IW | Unifi USW: 1x16-PoE Gen2 + 4x US-8-60W | Cloudkey Gen2 Plus
                      1 x NUC8i7BEH 32Go - ESXI 8 (Pfsense + many VM)

                      P 1 Reply Last reply Reply Quote 0
                      • P
                        pwnell @YannTKO
                        last edited by

                        @YannTKO Did that delete history?

                        Y 1 Reply Last reply Reply Quote 0
                        • Y
                          YannTKO @pwnell
                          last edited by

                          @pwnell Yes

                          Netgate SG-3100 23.09.1
                          Unifi UAP: 1x FlexHD + 2x nanoHD + 1x AC-IW | Unifi USW: 1x16-PoE Gen2 + 4x US-8-60W | Cloudkey Gen2 Plus
                          1 x NUC8i7BEH 32Go - ESXI 8 (Pfsense + many VM)

                          1 Reply Last reply Reply Quote 0
                          • P
                            pwnell
                            last edited by

                            I have a feeling this will not fix your issue. The problem is vnstat 2.4 now returns more than 24 hours of data - unlike before. So the code has to change in the php file to limit to the latest 24 hours. I am sure in 2 days you will again have > 24 entries...

                            1 Reply Last reply Reply Quote 0
                            • Y
                              YannTKO
                              last edited by

                              I solved the top 10 days view issue by editing the file "status_traffic_totals.php"

                              Replace

                              value.id+1
                              

                              by

                              index
                              

                              Before:

                              $.each(raw_json.interfaces[interface_index].traffic.top, function(index, value) {
                              var date = Date.UTC(value.date.year, value.date.month-1, value.date.day);
                              localStorage.setItem(value.id+1, date);
                              tx_series.push([value.id+1, value.tx]);
                              rx_series.push([value.id+1, value.rx]);
                              

                              After:

                              $.each(raw_json.interfaces[interface_index].traffic.top, function(index, value) {
                              var date = Date.UTC(value.date.year, value.date.month-1, value.date.day);
                              ocalStorage.setItem(index, date);
                              tx_series.push([index, value.tx]);
                              rx_series.push([index, value.rx]);


                              Capture d’écran 2.jpg
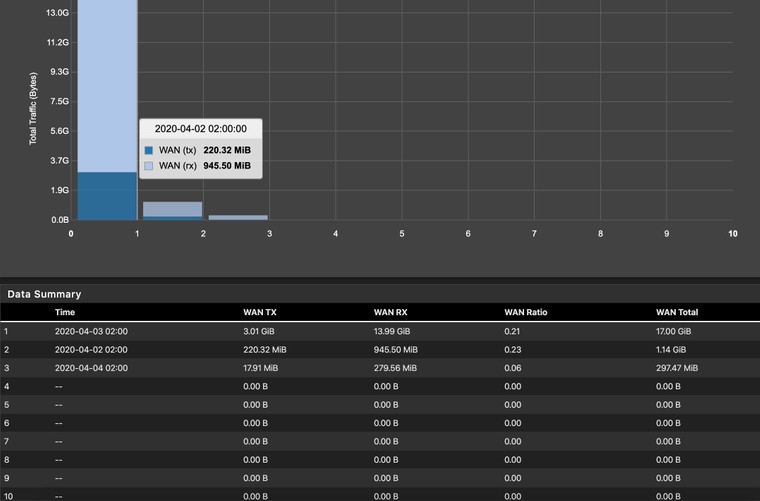
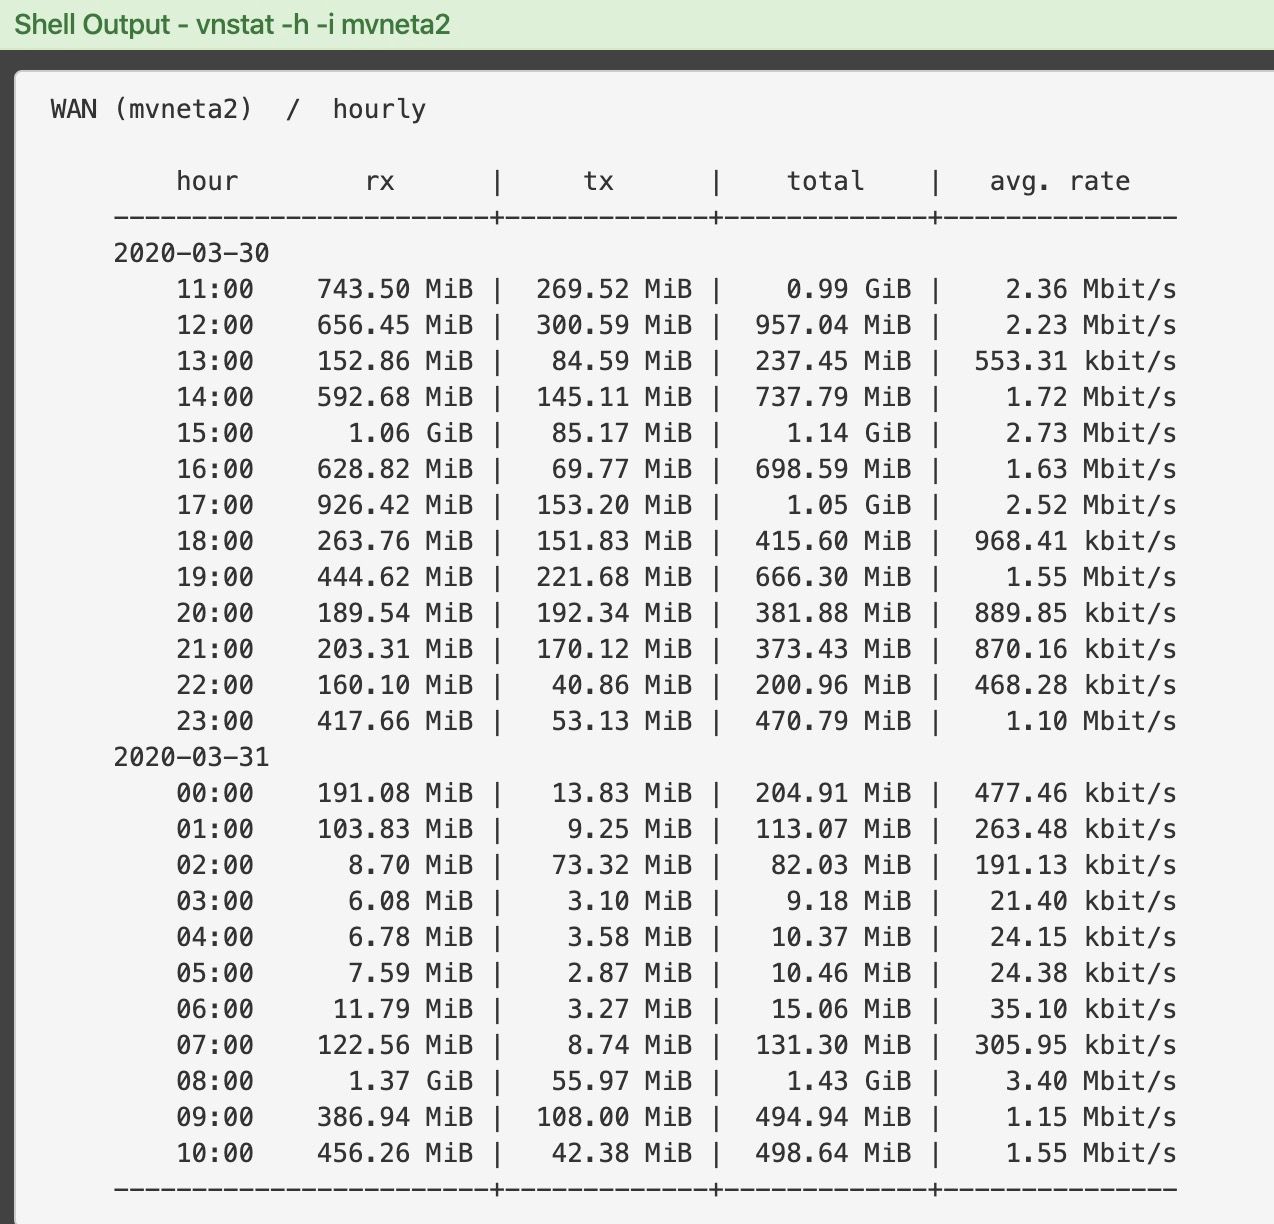
                              @pwnell You are right, the hourly report seems to record 48 hours and not 24.

                              Yann.

                              Netgate SG-3100 23.09.1
                              Unifi UAP: 1x FlexHD + 2x nanoHD + 1x AC-IW | Unifi USW: 1x16-PoE Gen2 + 4x US-8-60W | Cloudkey Gen2 Plus
                              1 x NUC8i7BEH 32Go - ESXI 8 (Pfsense + many VM)

                              P 1 Reply Last reply Reply Quote 0
                              • P
                                pwnell @YannTKO
                                last edited by

                                @YannTKO I tried that too but thought it failed because the x axis did not show the dates. But that is definitely better than before, thanks.

                                Y 1 Reply Last reply Reply Quote 0
                                • Y
                                  YannTKO @pwnell
                                  last edited by

                                  @pwnell For me, the x-axis has never shown the date. It has always been from 1 to 10.

                                  Netgate SG-3100 23.09.1
                                  Unifi UAP: 1x FlexHD + 2x nanoHD + 1x AC-IW | Unifi USW: 1x16-PoE Gen2 + 4x US-8-60W | Cloudkey Gen2 Plus
                                  1 x NUC8i7BEH 32Go - ESXI 8 (Pfsense + many VM)

                                  1 Reply Last reply Reply Quote 0
                                  • Y
                                    YannTKO
                                    last edited by

                                    Hello,
                                    I confirm that the hourly report shows more than 2 days (maybe 4).
                                    To return back to 24 hours, I edited (I know I shouldn't edit this file but it's a try) :
                                    /usr/local/etc/vnstat.conf

                                    to add:
                                    HourlyDays 1
                                    and I restarted the service .

                                    You can choose the data retention durations you need
                                    In the file vnstat.conf.sample, it's written:

                                    # data retention durations (-1 = unlimited, 0 = feature disabled)
                                    5MinuteHours   48
                                    HourlyDays      4
                                    DailyDays      62
                                    MonthlyMonths  25
                                    YearlyYears    -1
                                    TopDayEntries  20
                                    

                                    Yann

                                    Netgate SG-3100 23.09.1
                                    Unifi UAP: 1x FlexHD + 2x nanoHD + 1x AC-IW | Unifi USW: 1x16-PoE Gen2 + 4x US-8-60W | Cloudkey Gen2 Plus
                                    1 x NUC8i7BEH 32Go - ESXI 8 (Pfsense + many VM)

                                    1 Reply Last reply Reply Quote 0
                                    • Y
                                      YannTKO
                                      last edited by

                                      Beware, when you change your settings in traffic totals by the webgui and you save them as defaults, the file vnstat.conf is written again and you loose your data retention durations selection you choosed by editing this file.
                                      If you want to keep your selection or your options, you must edit the file /usr/local/pkg/status_traffic_totals.inc
                                      This one is used to create vnstat.conf

                                      Yann.

                                      Netgate SG-3100 23.09.1
                                      Unifi UAP: 1x FlexHD + 2x nanoHD + 1x AC-IW | Unifi USW: 1x16-PoE Gen2 + 4x US-8-60W | Cloudkey Gen2 Plus
                                      1 x NUC8i7BEH 32Go - ESXI 8 (Pfsense + many VM)

                                      1 Reply Last reply Reply Quote 1
                                      • House Of CardsH
                                        House Of Cards
                                        last edited by

                                        I'm following along here... Just to clarify. Are the totals recording correctly and it's just a display issue? Are the daily and monthly totals accurate?

                                        Y 1 Reply Last reply Reply Quote 0
                                        • Y
                                          YannTKO @House Of Cards
                                          last edited by YannTKO

                                          @wormuths Yes, it's just a display issue. You can check your data with vnstat in the shell. If you decide to change the data retention durations, it will affect your data and not only the display.

                                          Netgate SG-3100 23.09.1
                                          Unifi UAP: 1x FlexHD + 2x nanoHD + 1x AC-IW | Unifi USW: 1x16-PoE Gen2 + 4x US-8-60W | Cloudkey Gen2 Plus
                                          1 x NUC8i7BEH 32Go - ESXI 8 (Pfsense + many VM)

                                          1 Reply Last reply Reply Quote 3
                                          • M
                                            mariyan
                                            last edited by

                                            @YannTKO, thank you very much for figuring a fix for those graphing issues.

                                            1 Reply Last reply Reply Quote 0
                                            • First post
                                              Last post
                                            Copyright 2025 Rubicon Communications LLC (Netgate). All rights reserved.