Help getting unbound grafana dashboard working
-
you are lucky, i just started playing with this just yesterday
i don't have ElasticSearch, i tested this using telegraf on pfsense and grafana with InfluxDB in a raspberryin telegraf on pfsense
Additional configuration for Telegraf:[[inputs.unbound]]
binary = "/usr/local/sbin/unbound-control"
thread_as_tag = falseand i have the data on my grafana, the field list is long
-
@kiokoman said in Help getting unbound grafana dashboard working:
you are lucky, i just started playing with this just yesterday
i don't have ElasticSearch, i tested this using telegraf on pfsense and grafana with InfluxDB in a raspberryin telegraf on pfsense
Additional configuration for Telegraf:[[inputs.unbound]]
server = "127.0.0.1:53"
binary = "/usr/local/sbin/unbound-control -c /var/unbound/unbound.conf"
thread_as_tag = false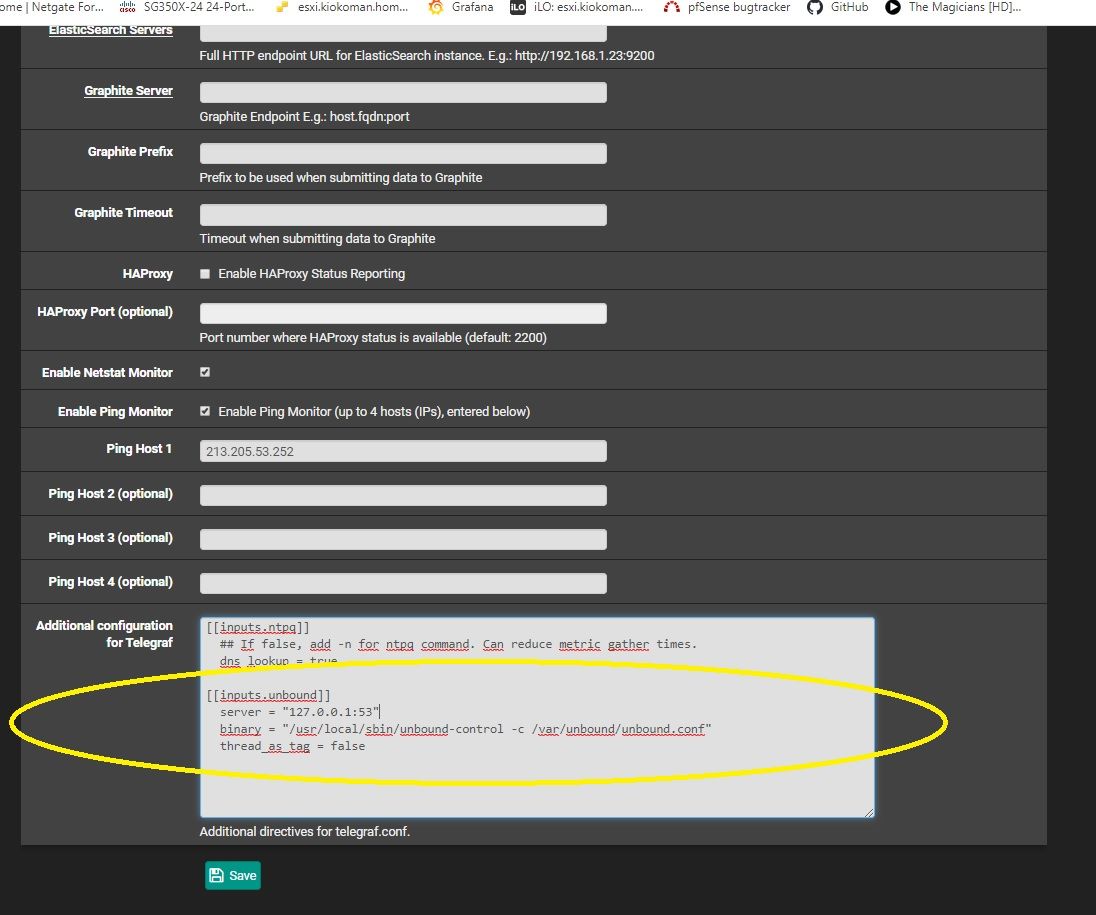
and i have the data on my grafana, the field list is long
Looks good @kiokoman and would definitely be simpler than installing everything that this guide uses. I wonder if all of the same information will be there for the graphs that he uses though.
Did you see the guide from the grafana dashboard page?
https://www.tumfatig.net/20180618/monitoring-unbound8-using-net-snmp-telegraf-influxdb-and-elasticsearch/
some really interesting dashboards and information that are usually default on pihole
-
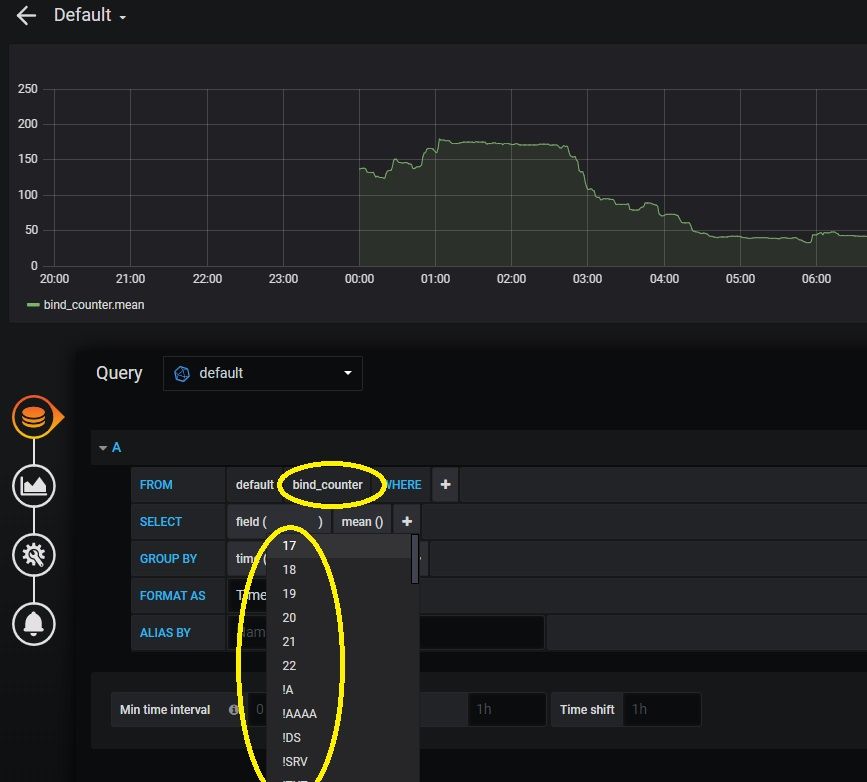
BTW i tried the additional config that you have and still don't see the bind_counter option when building up my query, not sure why?
-
 is unbound listening on port 53?
 -
@kiokoman It is, one thing I did notice is when i try and run the "/usr/local/sbin/unbound-control -c /var/unbound/unbound.conf" from command line it shows me the help options as if I am not doing something right. I have verified that the unbound.conf is there in that location and since it's showing me the command line help I am guessing the control script is there.
I did notice that doing a netstat -an that it shows *:53 maybe I need to configure unbound to just the loopback?
-
pfsense version?
i'm using 2.5.0 maybe it's different for older version, let me check -
@kiokoman 2.4.5
-
@bigjohns97 said in Help getting unbound grafana dashboard working:
/usr/local/sbin/unbound-control -c /var/unbound/unbound.conf
the command line work on 2.4.5 also,
the complete command is
/usr/local/sbin/unbound-control -c /var/unbound/unbound.conf statsif you want to try, that "stat" should be added by the telegraf plugin
now i check if the plugin is the same..
telegraf is the same version telegraf-1.13.4_1
it should work -
@kiokoman adding stats to the end did get me the output I was looking for via command line. I did noticed that I haven't updated any of my packages since upgrading to 2.4.5 so I did upgrade and now have the same version as you.
Did you leave unbound binded to all interfaces or did you select specific interfaces?
-
binded to all,
still nothing ater update?
i have this on my 2.4.52020-04-03T20:00:40Z E! [inputs.unbound] Error in plugin: error gathering metrics: error running unbound-control: fork/exec /usr/local/sbin/unbound-control -c /var/unbound/unbound.conf: no such file or directory (/usr/local/sbin/unbound-control -c /var/unbound/unbound.conf [-s 127.0.0.1@8853 stats_noreset])this is not happening on 2.5.0
investigation needed...
-
@kiokoman still nothing on the grafana side, I tried adding stats to the end of the command, I tried enabling the ping option like you have in your screenshot, nothing gave me the table in grafana, I have even been restarting grafana every time to make sure that wasn't it. I do know that it's resetting the telegraph instance because i can see the tcp session starting over as I am monitoring the session via pftop in the GUI.
I know it's working because my system stats dashboard is still working just fine.
-
uhm i have the same error on my 2.5.0 now.. but idk .. anyway
i was reading this
https://github.com/influxdata/telegraf/tree/master/plugins/inputs/unbound## The default location of the unbound config file can be overridden with: # config_file = "/etc/unbound/unbound.conf"but this does not work because config_file is not defined inside pfsense plugin
binary = "/usr/local/sbin/unbound-control"this work but if you add -c /var/unbound/unbound.conf it's unable to execute the command
the only workaround i found is to create a symlink inside the unbound-control default directory...
-c file config file, default is /usr/local/etc/unbound/unbound.confthe workaround is as follow:
rm /usr/local/etc/unbound/unbound.conf
ln -s /var/unbound/unbound.conf /usr/local/etc/unbound/unbound.conf
inside
telegraf on pfsense
Additional configuration for Telegraf:[[inputs.unbound]] binary = "/usr/local/sbin/unbound-control" thread_as_tag = falseto test the plugin:
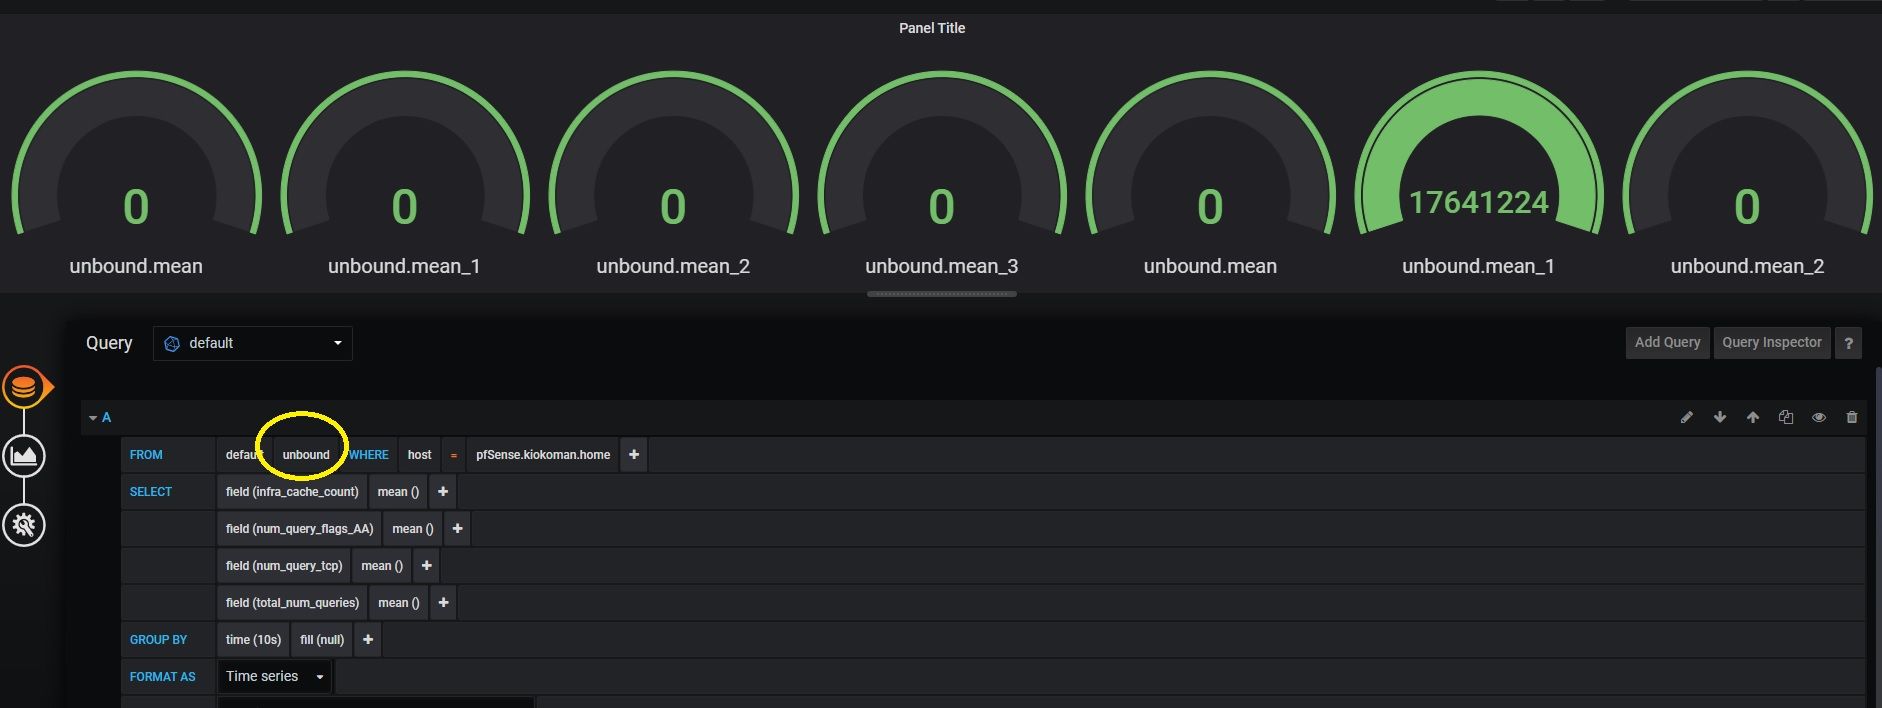
/usr/local/bin/telegraf -config=/usr/local/etc/telegraf.conf --test --input-filter unbound
2020-04-03T20:57:16Z I! Starting Telegraf 1.13.4
> unbound,host=pfSense.kiokoman.home infra_cache_count=0,key_cache_count=0,mem_cache_message=66072,mem_cache_rrset=66072,mem_mod_iterator=1bla bla bla
ah i found out what i was doing wrong, my bad sorry, as i said i started to use this only yesterday... the old pictures were about bind9 not unbound

-
@kiokoman said in Help getting unbound grafana dashboard working:
uhm i have the same error on my 2.5.0 now.. but idk .. anyway
i was reading this
https://github.com/influxdata/telegraf/tree/master/plugins/inputs/unbound## The default location of the unbound config file can be overridden with: # config_file = "/etc/unbound/unbound.conf"but this does not work because config_file is not defined inside pfsense plugin
binary = "/usr/local/sbin/unbound-control"this work but if you add -c /var/unbound/unbound.conf it's unable to execute the command
the only workaround i found is to create a symlink inside the unbound-control default directory...
-c file config file, default is /usr/local/etc/unbound/unbound.confthe workaround is as follow:
rm /usr/local/etc/unbound/unbound.conf
ln -s /var/unbound/unbound.conf /usr/local/etc/unbound/unbound.conf
inside
telegraf on pfsense
Additional configuration for Telegraf:[[inputs.unbound]] binary = "/usr/local/sbin/unbound-control" thread_as_tag = falseto test the plugin:
/usr/local/bin/telegraf -config=/usr/local/etc/telegraf.conf --test --input-filter unbound
2020-04-03T20:57:16Z I! Starting Telegraf 1.13.4
> unbound,host=pfSense.kiokoman.home infra_cache_count=0,key_cache_count=0,mem_cache_message=66072,mem_cache_rrset=66072,mem_mod_iterator=1bla bla bla
ah i found out what i was doing wrong, my bad sorry, as i said i started to use this only yesterday... the old pictures were about bind9 not unbound
I was able to get it working after doing the symlink what a crazy solution.
I am still interested in using the original dashboard I posted about along with a security based one that I found on reddit.
-
I do not know what is more crazy honestly, in the link you posted requires you to tamper with different system configurations that reset when you update pfsense,
this has been added to telegraf 4 month ago so it will eventually work on pfsense when they upgrade the package## The default location of the unbound config file can be overridden with: # config_file = "/etc/unbound/unbound.conf"and when this happens there will be no need for the symlink, keeping the system clean
-
@kiokoman said in Help getting unbound grafana dashboard working:
rm /usr/local/etc/unbound/unbound.conf
Hi,
I tried what you said, but dispite the conf file with
Unbound Statistics
statistics-interval: 0
extended-statistics: yes
statistics-cumulative: nothe stats is cumulative, which is no good for influx. How did you manage to make it not cumulative ?