[SOLVED] Suricata - LAN - src and dest are not local IPs in the logged alert?
-
Hi all,
I'm definitely a suricata noob and I'm having a really hard time finding an answer online to this. In the alerts logs for the LAN interface I'm getting flooded by alerts with src and dest IP addresses which definitely aren't local. If anybody could explain it to me I'd be very grateful.
Proto: UDP
Class: Generic Protocol Command Decode
Description: SURICATA IPv4 invalid checksumthanks!
-
What exactly do you mean by "not local"? Give some examples, please.
Are you running Suricata on the LAN interface?
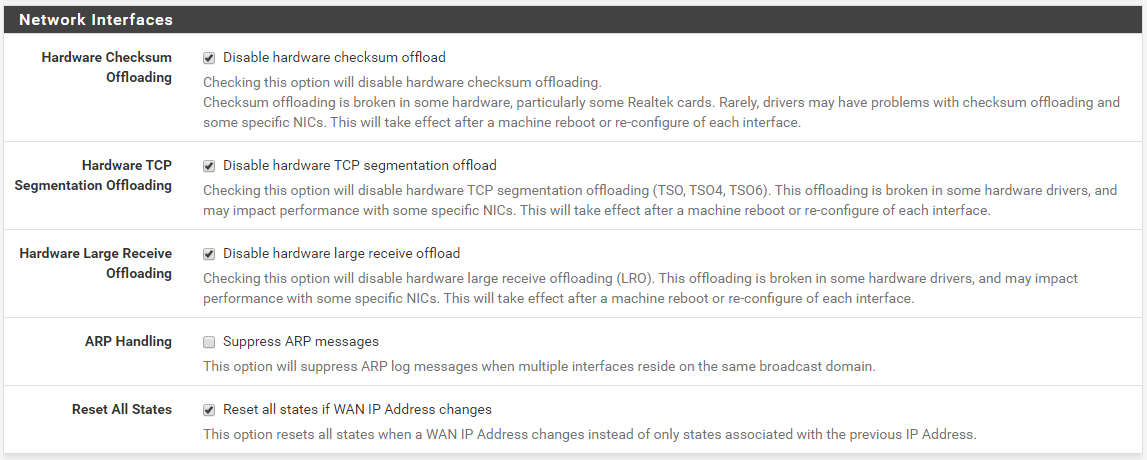
Have you disabled all of the hardware offloading options under SYSTEM > ADVANCED on the Networking tab as shown below?
-
Hi, thanks for replying,
By local I mean LAN subnet starting with 192.168.... (hope i'm using the correct terminology)
Yes Suricata is only running on the LAN interface and all hardware offloading options are disabled (boxes are checked).
Here's an example of an alert (it's always the same two IP addresses):
05/24/2020-12:15:54.144887 [] [1:2200073:2] SURICATA IPv4 invalid checksum [] [Classification: Generic Protocol Command Decode] [Priority: 3] {UDP} 103.xxx.xxx.xx:32768 -> 239.xxx.xxx.xx:5001thanks for any insight into this. It looks to me like WAN traffic but why would it show up on the LAN interface alerts.
-
If you are seeing WAN traffic on your LAN interface, then you have a network configuration issue that is outside of pfSense and Suricata. Possibilities would be network cables plugged into incorrect switch ports and thus essentially bypassing the firewall, or your ISP-supplied modem or equivalent might have Wi-Fi enabled behind your back, or if you are using VLANs your switch is either leaking VLAN traffic among ports or is not configured properly (and either of these would be bad).
Now for another possibility. Do you have multiple Suricata instances configured? If so, when you view the ALERTS tab, that is for all configured Suricata interfaces. You choose which alerts to see by clicking the Interface drop-down selector on that tab. It will always default to the first Suricata interface you configured. So if you have multiple Suricata instances on the firewall, are you choosing which interface to look at when clicking the ALERTS tab?
-
hmm, no VLANs configured, everything connected properly, cable modem -> pfsense WAN, pfsense LAN -> access point/router . Nothing fancy. I also have pfblockerNG installed.
No other suricata instances configured as far as I can tell (only one drop down in the alerts, as it was before as well) . I just removed the suricata package (config and logs) to be sure and reinstalled it just for the LAN interface. Still getting those messages. Very weird. In the firewall I set a rule to block the traffic, it's not triggered.
Could it be multicast traffic? Should I be seeing that on the LAN interface?
Gah, i shouldn't have installed suricata, i was happier then :)
-
Suricata is NOT generating that traffic! It is only detecting what is there. Now Suricata will put an interface into promiscuous mode when it is running, and in that mode the NIC will capture all traffic on the wire including traffic outside the designated subnet of the interface. So by being in promiscuous mode the NIC interface is feeding in those IP addresses.
But what that means is that traffic is actually on your wire coming out of the switch port that connects to your pfSense LAN port. So I go back to my original hypothesis. You have something on your LAN that is spewing those IP addresses. My bet is that you do indeed have a misconfiguration someplace in your network. That misconfiguration could be an errant cable or something like a dual-homed machine someplace.
On the LAN, most users have the default "any any pass" rule in the firewall, thus pfSense will not be logging that traffic even though it is there. Have you tried creating some rules on the LAN side of pfSense to log that traffic? If nothing else, just temporarily turn on logging for the default "pass all" rule and see what shows up in the firewall logs.
-
yes, I know suricata is not generating traffic.
yup, that's what was worrying and confusing me, that something on my LAN is misbehaving or has been compromised. I wasn't sure what kind of traffic suricata was logging on the LAN interface, if something like what I was seeing is normal or not.
I did as you suggested and turn on logging for the pass all rule, thanks for the tip, however there's nothing there related to those IP addresses. there are no errant cables
Not the way I like to do things but i'm going to reset my netgate device and set things up from scratch again just to be sure that I haven't messed up my firewall configuration somehow.
-
Do you have any other packages installed? Maybe something like avahi? That 239.x.x.x address is a multicast address. There is no need to obfuscate it, Show the entire address. There are at least two other posts on the forum where folks are seeing multicast addresses on unexpected interfaces.
Also, that particular alert you are seeing is for an invalid IPv4 checksum. That usually happens when the NIC offloading options are not correctly specified. See the image I posted earlier and make sure your firewall is configured similarly.
-
nope, just suricata and pfblockerNG are installed. Mildly reassuring that other people are seeing something similar :).
yes, the offloading options are correctly specified.
[edit, the reset didn't change anything. alerts still showing up just with the snort rules enabled. blergh, frustrating, i'm at my wits end]
-
Is it always the exact same two IP addresses showing up? If so, then you may have a device on your LAN with either an incorrect IP address, or it is somehow configured with two IP addresses. The 239.x.x.x address is a multicast address. It is part of a subnet defined by the RFC for multicast networking. Here is a Cisco presentation (in PDF format) on multicast networking: https://www.cisco.com/c/dam/en/us/products/collateral/ios-nx-os-software/ip-multicast/prod_presentation0900aecd80310883.pdf.
And here is the big list of IANA multicast address space: https://www.iana.org/assignments/multicast-addresses/multicast-addresses.xhtml. So after reading this you will see that the 239.x.x.x address is basically harmless and represents multicast destination. It is within the Administratively Scoped Block typically used for local destinations.
What is the 103.x.x.x address you obfuscated? Is that network part of your WAN? If not, then un-obfuscate it and let me see what the actual value is.
-
Hopefully somebody will find this useful.
Well I found the culprits the hard way by disconnecting all devices and reconnecting them one by one. Later I found an easier way by using wireshark to monitor network traffic, and confirmed the mac addresses matched the devices in question.
It's my nvidia Shield TV 2019 boxes which are generating this every 15 minutes if connected via wifi. It has been confirmed non-malicious, some sort of bandwidth estimator, by nvidia. I find the source IP odd but ok... for the moment I've added it to my suppress list.
The exact suricata alert is:
[] [1:2200073:2] SURICATA IPv4 invalid checksum [] [Classification: Generic Protocol Command Decode] [Priority: 3] {UDP} 103.69.35.1:32768 -> 239.205.171.137:5001If I understand things correctly from reading around it seems that administratively scoped multicast messages should not be leaving my network anyways unless I explicitly set up forwarding rules in the firewall? Dunno, I'm not a network/firewall expert.
-
@Surreallo Thanks for reporting your findings. I just observed the same traffic through Suricata LAN interface; searched for forum for explanation as it was odd. I have recently introduced a NVIDIA Shield to the network so can confirm the same culprit.
-
Some of the things the Smart TV and IoT vendors are doing today with networking is just plain weird! I wonder sometimes if their software developers really and truly understand networking ???