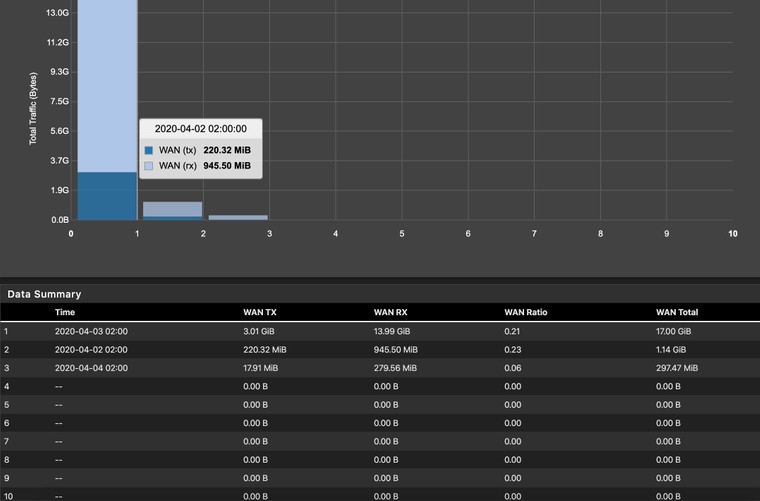
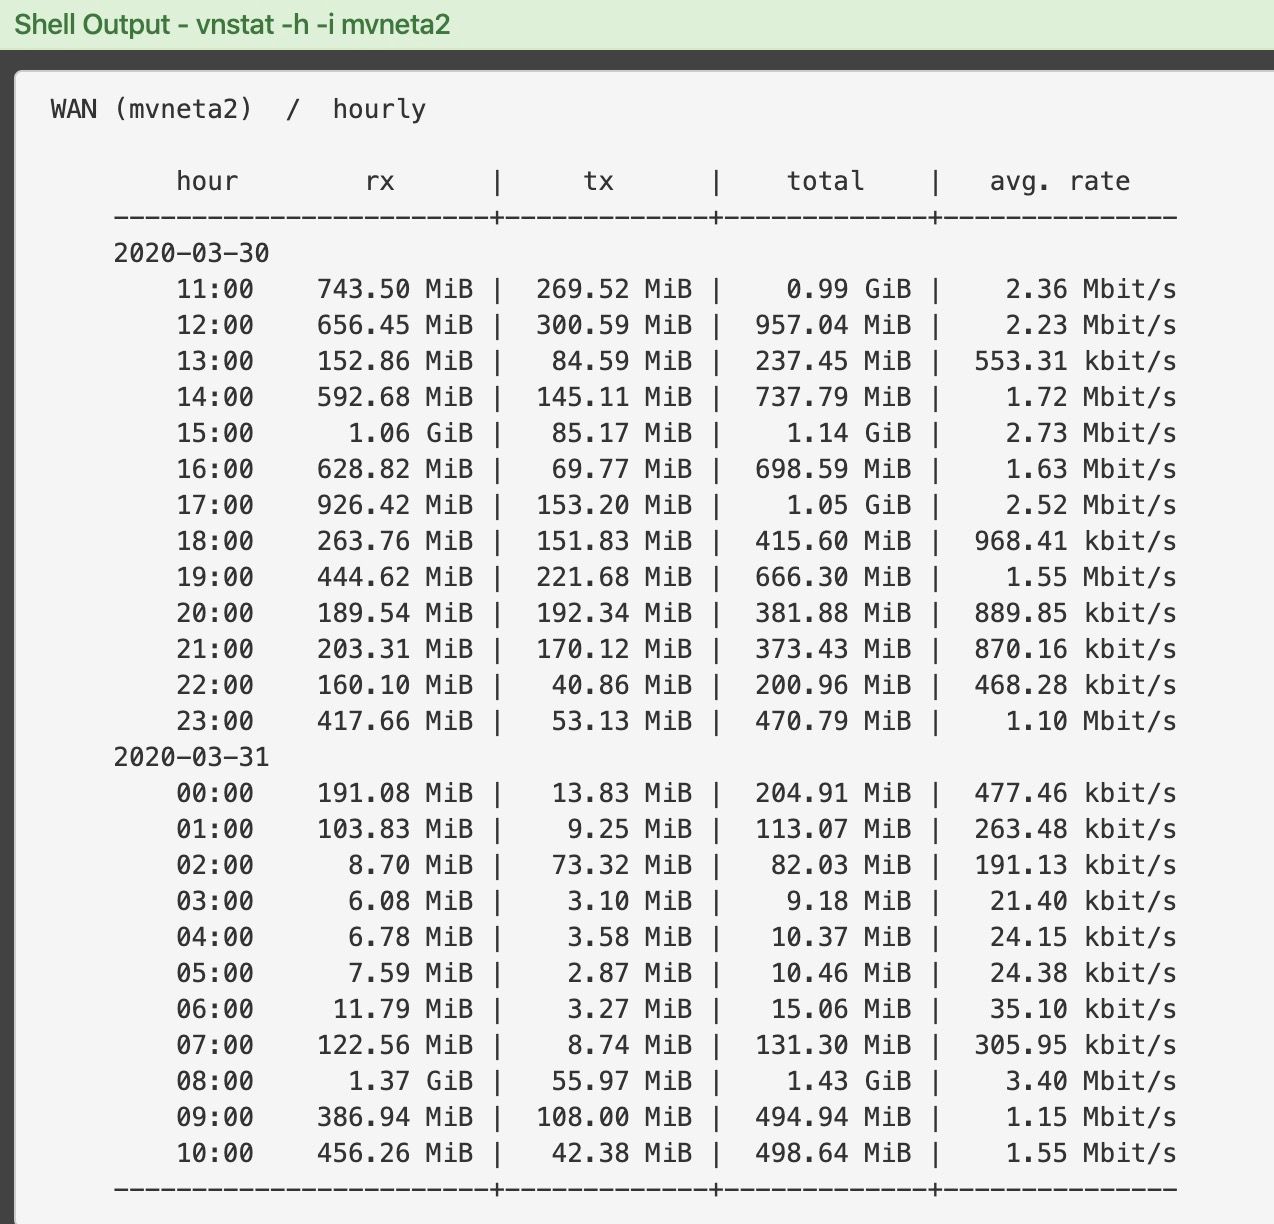
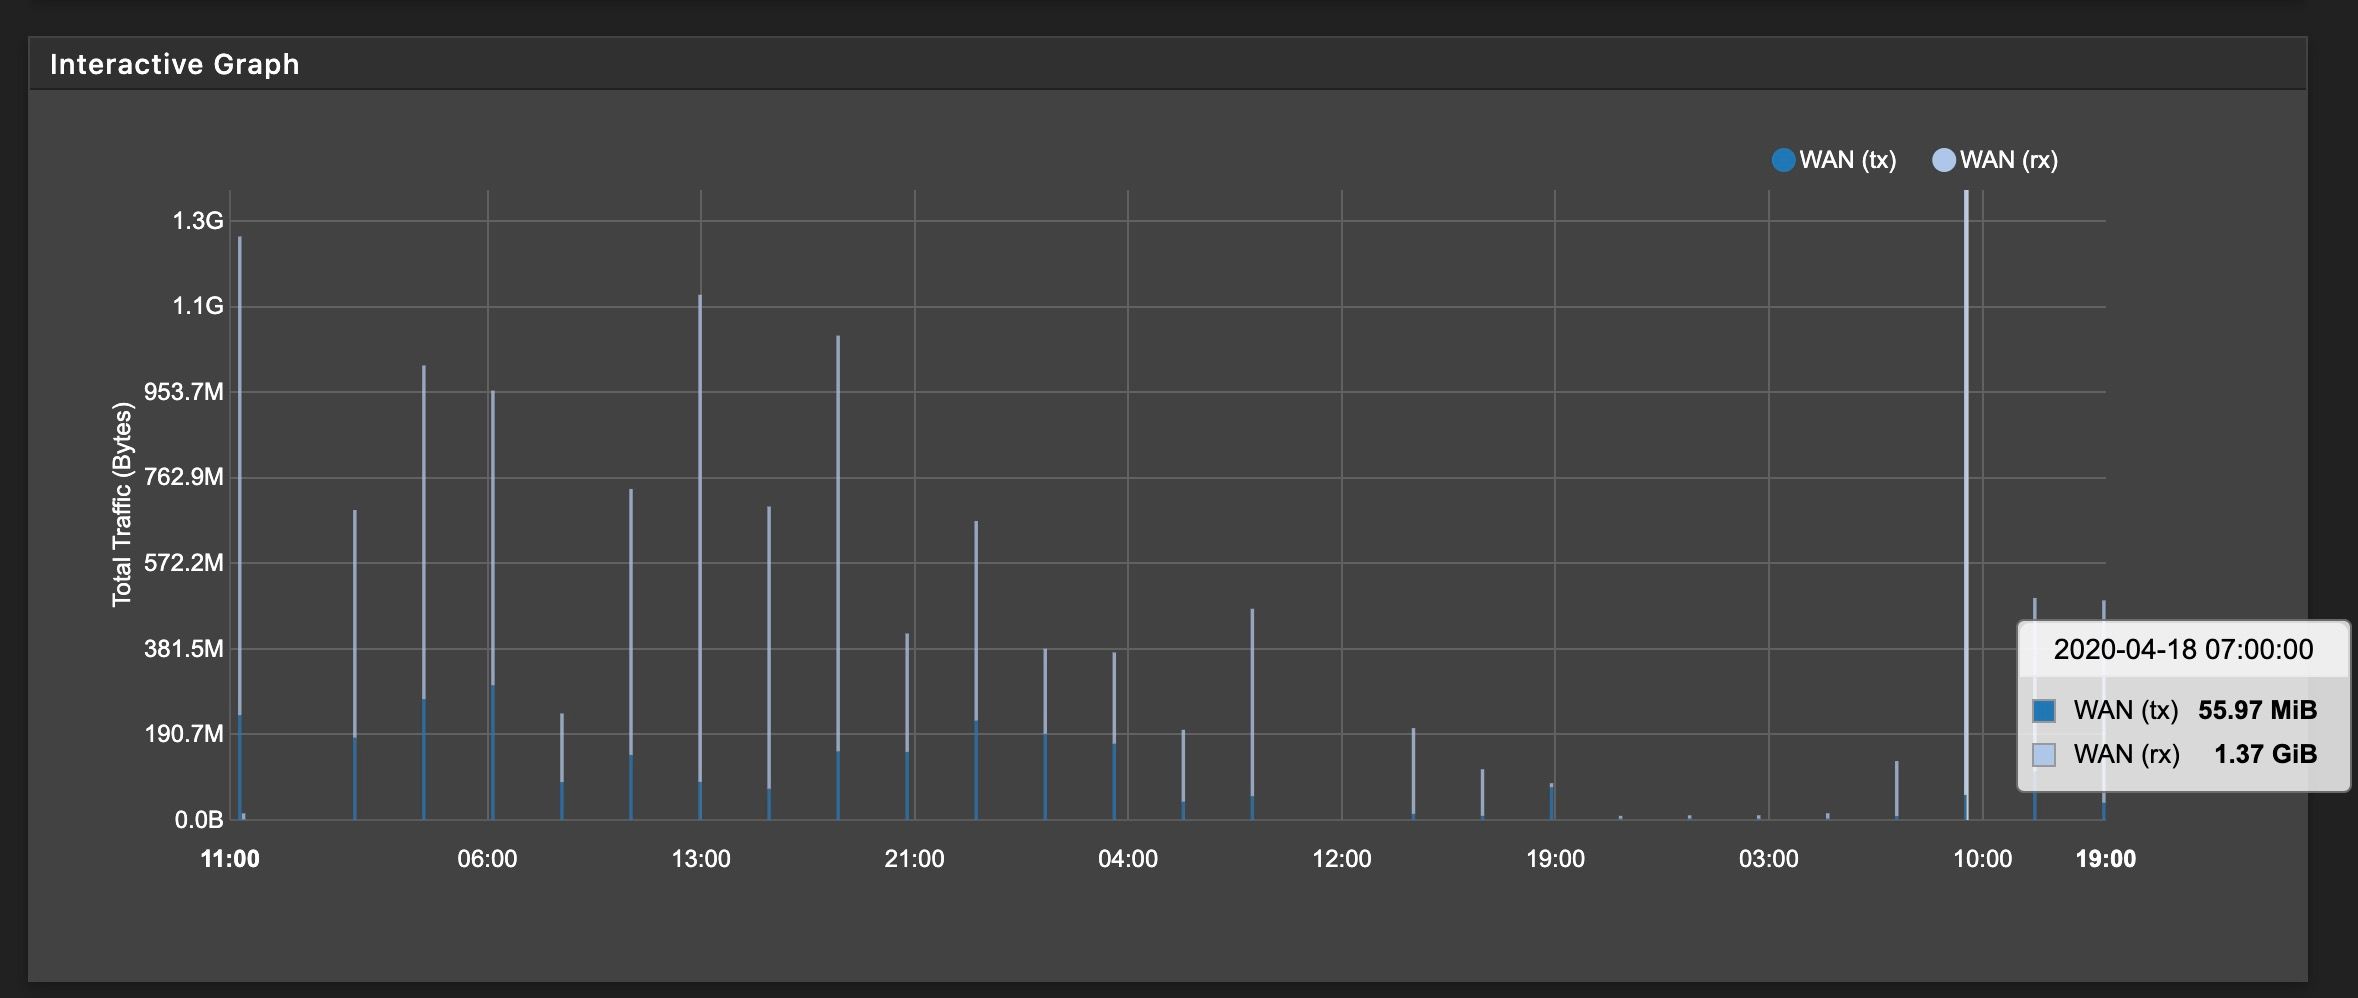
Traffic Totals Hourly Report Problem
-
I have a feeling this will not fix your issue. The problem is vnstat 2.4 now returns more than 24 hours of data - unlike before. So the code has to change in the php file to limit to the latest 24 hours. I am sure in 2 days you will again have > 24 entries...
-
I solved the top 10 days view issue by editing the file "status_traffic_totals.php"
Replace
value.id+1by
indexBefore:
$.each(raw_json.interfaces[interface_index].traffic.top, function(index, value) {
var date = Date.UTC(value.date.year, value.date.month-1, value.date.day);
localStorage.setItem(value.id+1, date);
tx_series.push([value.id+1, value.tx]);
rx_series.push([value.id+1, value.rx]);
After:
$.each(raw_json.interfaces[interface_index].traffic.top, function(index, value) {
var date = Date.UTC(value.date.year, value.date.month-1, value.date.day);
ocalStorage.setItem(index, date);
tx_series.push([index, value.tx]);
rx_series.push([index, value.rx]);
@pwnell You are right, the hourly report seems to record 48 hours and not 24.Yann.
-
@YannTKO I tried that too but thought it failed because the x axis did not show the dates. But that is definitely better than before, thanks.
-
@pwnell For me, the x-axis has never shown the date. It has always been from 1 to 10.
-
Hello,
I confirm that the hourly report shows more than 2 days (maybe 4).
To return back to 24 hours, I edited (I know I shouldn't edit this file but it's a try) :
/usr/local/etc/vnstat.confto add:
HourlyDays 1
and I restarted the service .You can choose the data retention durations you need
In the file vnstat.conf.sample, it's written:# data retention durations (-1 = unlimited, 0 = feature disabled) 5MinuteHours 48 HourlyDays 4 DailyDays 62 MonthlyMonths 25 YearlyYears -1 TopDayEntries 20Yann
-
Beware, when you change your settings in traffic totals by the webgui and you save them as defaults, the file vnstat.conf is written again and you loose your data retention durations selection you choosed by editing this file.
If you want to keep your selection or your options, you must edit the file /usr/local/pkg/status_traffic_totals.inc
This one is used to create vnstat.confYann.
-
I'm following along here... Just to clarify. Are the totals recording correctly and it's just a display issue? Are the daily and monthly totals accurate?
-
@wormuths Yes, it's just a display issue. You can check your data with vnstat in the shell. If you decide to change the data retention durations, it will affect your data and not only the display.
-
@YannTKO, thank you very much for figuring a fix for those graphing issues.
-
Can anyone generate a system > patches files.
I am afraid i will really mess something up if I try manually changing files
Thanks
Myk -
Nobody?
-
@pwnell Thank you this fixed my current problem where the hourly graph looked like the first image since I did a fresh install of 2.4.5
-
Yeah, if this is an issue, someone should write up a bug in Redmine (use the pfSense Packages section and the Status Traffic Totals category) and then update the package in Github so everyone can benefit from the change and easily apply a system patch in the meantime. Manually changing files works great until a file you changed is updated, then your change disappears. At least a system patch can be re-applied without re-editing the file.
-
@pwnell said in Traffic Totals Hourly Report Problem:
value.time.hour
Just tried to create a pull request on GitHub what a mess that turned out to be. IF I have time later will try and do something in a non web version but that wasn't easy at all and it was a simple change to fix the hourly display on 2.4.5
-
@virgiliomi said in Traffic Totals Hourly Report Problem:
Yeah, if this is an issue, someone should write up a bug in Redmine (use the pfSense Packages section and the Status Traffic Totals category) and then update the package in Github so everyone can benefit from the change and easily apply a system patch in the meantime. Manually changing files works great until a file you changed is updated, then your change disappears. At least a system patch can be re-applied without re-editing the file.
you can solve this issue by editing the file:
/usr/local/pkg/status_traffic_totals.inc@YannTKO said in Traffic Totals Hourly Report Problem:
Beware, when you change your settings in traffic totals by the webgui and you save them as defaults, the file vnstat.conf is written again and you loose your data retention durations selection you choosed by editing this file.
If you want to keep your selection or your options, you must edit the file /usr/local/pkg/status_traffic_totals.inc
This one is used to create vnstat.confYann.
-
@hulleyrob said in Traffic Totals Hourly Report Problem:
@pwnell said in Traffic Totals Hourly Report Problem:
value.time.hour
Just tried to create a pull request on GitHub what a mess that turned out to be. IF I have time later will try and do something in a non web version but that wasn't easy at all and it was a simple change to fix the hourly display on 2.4.5
It has been already done :
redmine.pfsense.org/issues/10429 -
I have the same issues too... First i thought i was the only one to have issues until i saw this thread :) .. I just installed it and then removed it again when it turned out it was not working properly..
-
@YannTKO said in Traffic Totals Hourly Report Problem:
/usr/local/pkg/status_traffic_totals.inc
guess I am dumb and dont understand what to change in this file, any push in the right direction?
-
@MyKroFt so you are happy to get to the file and edit it on the command line?
I just open it with VI find "value.id" this and the first line that matched was the one in the post above by @pwnell
"var date = Date.UTC(value.date.year, value.date.month-1, value.date.day, value.id);"
then edit value.id to value.time.hour
This fixed the hourly graphs for me which is all I was interested in. Save then quit and refresh the page job done.
-
Editing /usr/local/pkg/status_traffic_totals.inc is just to keep data retention choice.
Editing status_traffic_totals.php is to solve the hourly/10 days graphical issues.
Yann.


