Suricata-5.0.3 Package Update -- Release Notes (pfSense-2.5 DEVEL)
-
@kiokoman said in Suricata-5.0.3 Package Update -- Release Notes (pfSense-2.5 DEVEL):
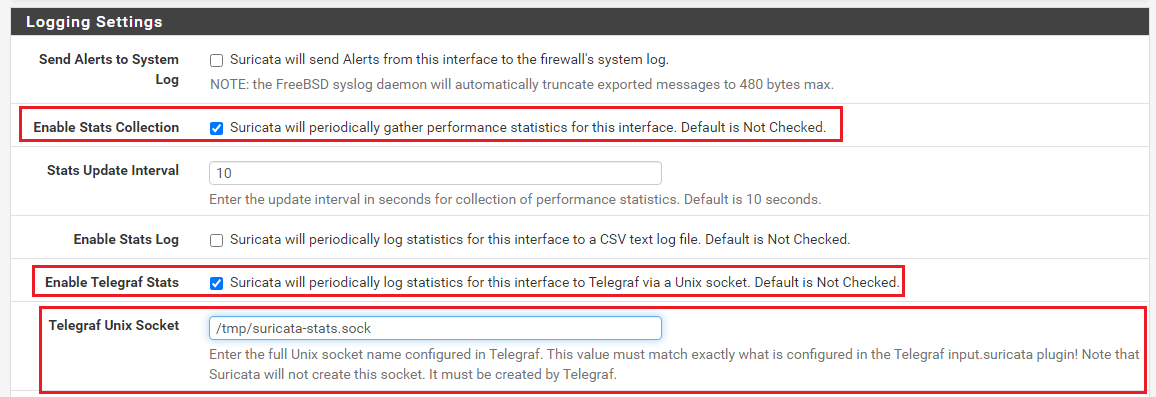
sadly the telegraf stuff does not work anymore, i need to investigate.
the data are sent from suricata to the socket but telegraf does not grab itI didn't have a telgraf installation to test with. All I did in the PHP code was add code to create the entry in
suricata.yamlthat generates a separate EVE log with the "unix_stream" output type.Let me know what you discover. Perhaps some changes are needed on the Suricata side ???
-
[2.5.0-DEVELOPMENT][root@pfSense.kiokoman.home]/var/run: nc -lkU suricataWAN-stats.sock
{"timestamp":"2020-07-15T15:59:22.616765+0200","event_type":"stats","stats":{"uptime":43,"capture":{"kernel_packets":549,"kernel_drops":0,"kernel_ifdrops":0},"decoder":{"pkts":549,"bytes":75660,"invalid":0,"ipv4":549,"ipv6":25,"ethernet":0,"raw":0,"null":549,"sll":0,"tcp":16,"udp":480 alot of stuff here ...
but
[2.5.0-DEVELOPMENT][root@pfSense.kiokoman.home]/var/run: /usr/local/bin/telegraf --debug -config=/root/telegraf.conf
2020-07-15T14:03:13Z I! Starting Telegraf 1.13.4
2020-07-15T14:03:13Z I! Loaded inputs: suricata
2020-07-15T14:03:13Z I! Loaded aggregators:
2020-07-15T14:03:13Z I! Loaded processors:
2020-07-15T14:03:13Z I! Loaded outputs: influxdb
2020-07-15T14:03:13Z I! Tags enabled: host=pfSense.kiokoman.home
2020-07-15T14:03:13Z I! [agent] Config: Interval:10s, Quiet:false, Hostname:"pfSense.kiokoman.home", Flush Interval:10s
2020-07-15T14:03:13Z D! [agent] Initializing plugins
2020-07-15T14:03:13Z D! [agent] Connecting outputs
2020-07-15T14:03:13Z D! [agent] Attempting connection to [outputs.influxdb]
2020-07-15T14:03:13Z D! [agent] Successfully connected to outputs.influxdb
2020-07-15T14:03:13Z D! [agent] Starting service inputs
2020-07-15T14:03:30Z D! [outputs.influxdb] Buffer fullness: 0 / 10000 metrics
i think there is something on telegraf
-
@kiokoman said in Suricata-5.0.3 Package Update -- Release Notes (pfSense-2.5 DEVEL):
[2.5.0-DEVELOPMENT][root@pfSense.kiokoman.home]/var/run: nc -lkU suricataWAN-stats.sock
{"timestamp":"2020-07-15T15:59:22.616765+0200","event_type":"stats","stats":{"uptime":43,"capture":{"kernel_packets":549,"kernel_drops":0,"kernel_ifdrops":0},"decoder":{"pkts":549,"bytes":75660,"invalid":0,"ipv4":549,"ipv6":25,"ethernet":0,"raw":0,"null":549,"sll":0,"tcp":16,"udp":480 alot of stuff here ...
but
[2.5.0-DEVELOPMENT][root@pfSense.kiokoman.home]/var/run: /usr/local/bin/telegraf --debug -config=/root/telegraf.conf
2020-07-15T14:03:13Z I! Starting Telegraf 1.13.4
2020-07-15T14:03:13Z I! Loaded inputs: suricata
2020-07-15T14:03:13Z I! Loaded aggregators:
2020-07-15T14:03:13Z I! Loaded processors:
2020-07-15T14:03:13Z I! Loaded outputs: influxdb
2020-07-15T14:03:13Z I! Tags enabled: host=pfSense.kiokoman.home
2020-07-15T14:03:13Z I! [agent] Config: Interval:10s, Quiet:false, Hostname:"pfSense.kiokoman.home", Flush Interval:10s
2020-07-15T14:03:13Z D! [agent] Initializing plugins
2020-07-15T14:03:13Z D! [agent] Connecting outputs
2020-07-15T14:03:13Z D! [agent] Attempting connection to [outputs.influxdb]
2020-07-15T14:03:13Z D! [agent] Successfully connected to outputs.influxdb
2020-07-15T14:03:13Z D! [agent] Starting service inputs
2020-07-15T14:03:30Z D! [outputs.influxdb] Buffer fullness: 0 / 10000 metrics
i think there is something on telegraf
Suricata is certainly spewing stats out through the socket, so that part is working. I agree it is likely on the telegraf side. I'm not familiar with telegraf having never used it. Are there some debugging options to have telegraf log someplace the raw data it is getting from the socket?
Here is the original Feature Request: https://redmine.pfsense.org/issues/10421#change-47203. The creator of the request claimed to have it working (although he had to manually edit the
suricata.yamlfile). I duplicated in the PHP code what he did on the Suricata side.EDIT: never mind, just realized you were the creator of the Feature Request ...

-
yes, i was the one requesting it, it was working at that time, maybe it was before the upgrade to freebsd 12.1-stable
now telegraf does not work anymorefrom debug i have this
_umtx_op(0x45d95f8,UMTX_OP_WAKE_PRIVATE,0x1,0x0,0x0) = 0 (0x0)
_umtx_op(0x45d95f8,UMTX_OP_WAIT_UINT_PRIVATE,0x0,0x18,0xc000079e48) = 0 (0x0)
write(2,"2020-07-15T16:40:06Z D! [outputs"...,78) = 78 (0x4e)
nanosleep({ 0.000020000 })                       = 0 (0x0)
thr_kill(100746,SIGURG)                          = 0 (0x0)
SIGNAL 16 (SIGURG) code=SI_LWP pid=69801 uid=0
nanosleep({ 0.000020000 })                       = 0 (0x0)
sigreturn(0xc000087b00)                          EJUSTRETURN
nanosleep({ 0.000020000 })                       = 0 (0x0)
nanosleep({ 0.000020000 })                       = 0 (0x0)
compat11.kevent(3,0x0,0,{ },64,{ 3.378182125 })  = 0 (0x0)
compat11.kevent(3,0x0,0,{ },64,{ 0.000000000 })  = 0 (0x0)
_umtx_op(0xc00006a4d0,UMTX_OP_WAKE_PRIVATE,0x1,0x0,0x0) = 0 (0x0)
_umtx_op(0xc00006a4d0,UMTX_OP_WAIT_UINT_PRIVATE,0x0,0x18,0x0) = 0 (0x0)
compat11.kevent(3,0x0,0,{ },64,{ 0.000000000 })  = 0 (0x0)
nanosleep({ 0.000003000 })                       = 0 (0x0)
_umtx_op(0xc000247650,UMTX_OP_WAKE_PRIVATE,0x1,0x0,0x0) = 0 (0x0)
_umtx_op(0xc000247650,UMTX_OP_WAIT_UINT_PRIVATE,0x0,0x18,0x0) = 0 (0x0)
_umtx_op(0x45d95f8,UMTX_OP_WAIT_UINT_PRIVATE,0x0,0x18,0xc000079e48) ERR#60 'Operation timed out'
nanosleep({ 0.000020000 })                       = 0 (0x0)
_umtx_op(0x45d95f8,UMTX_OP_WAIT_UINT_PRIVATE,0x0,0x18,0xc000079e48) ERR#60 'Operation timed out'
compat11.kevent(3,0x0,0,{ },64,{ 1.567486309 })  = 0 (0x0)
_umtx_op(0xc000246f50,UMTX_OP_WAKE_PRIVATE,0x1,0x0,0x0) = 0 (0x0)
compat11.kevent(3,0x0,0,{ },64,{ 0.000000000 })  = 0 (0x0)
_umtx_op(0xc000246f50,UMTX_OP_WAIT_UINT_PRIVATE,0x0,0x18,0x0) = 0 (0x0)
nanosleep({ 0.000020000 })                       = 0 (0x0)
_umtx_op(0xc000247650,UMTX_OP_WAKE_PRIVATE,0x1,0x0,0x0) = 0 (0x0)
_umtx_op(0xc000247650,UMTX_OP_WAIT_UINT_PRIVATE,0x0,0x18,0x0) = 0 (0x0)
sched_yield()                                    = 0 (0x0)
nanosleep({ 0.000020000 })                       = 0 (0x0)
compat11.kevent(3,0x0,0,{ },64,{ 0.000000000 })  = 0 (0x0)
_umtx_op(0xc00005a768,UMTX_OP_WAKE_PRIVATE,0x1,0x0,0x0) = 0 (0x0)
nanosleep({ 0.000020000 })                       = 0 (0x0)
nanosleep({ 0.000020000 })                       = 0 (0x0)
sched_yield()                                    = 0 (0x0)
_umtx_op(0x45d94f8,UMTX_OP_WAKE_PRIVATE,0x1,0x0,0x0) = 0 (0x0)
compat11.kevent(3,0x0,0,{ 9,EVFILT_READ,EV_CLEAR,0,0x2000,0x82b10ce90 },64,{ 4.958977535 }) = 1 (0x1)
_umtx_op(0x45d95f8,UMTX_OP_WAKE_PRIVATE,0x1,0x0,0x0) = 0 (0x0)
_umtx_op(0x45d95f8,UMTX_OP_WAIT_UINT_PRIVATE,0x0,0x18,0xc000079e48) = 0 (0x0)
read(9,"{"timestamp":"2020-07-15T18:40:1"...,10420224) = 8192 (0x2000)
nanosleep({ 0.000020000 })                       = 0 (0x0)
nanosleep({ 0.000020000 })                       = 0 (0x0)
read(9,0xc00095a000,10412032)                    ERR#35 'Resource temporarily unavailable'
nanosleep({ 0.000020000 })                       = 0 (0x0)
nanosleep({ 0.000020000 })                       = 0 (0x0)
compat11.kevent(3,0x0,0,{ },64,{ 0.000000000 })  = 0 (0x0)
as you can see there is a
read(9,"{"timestamp":"2020-07-15T18:40:1"...,10420224)that's part of the output from suricata
followed by
read(9,0xc00095a000,10412032) ERR#35 'Resource temporarily unavailable'well, i have no idea, i also tried with Telegraf 1.15.0 but same error/problem
-
FYI. As of today (Thursday, July 16th), barring no major issues showing up the DEVEL branch, the plan is to migrate this 5.0.3 Suricata package update over to pfSense-2.4.5_p1 RELEASE Monday or Tuesday of next week (July 20th or 21st).
-
@bmeeks maybe i found something,
the suricata plugin of telegraf is expecting \n at the end of the line but i think it's never coming,
it seems to be truncated at the end
any settings from suricata that can solve this?example coming from unix socket
{"timestamp":"2020-07-17T10:08:18.856758+0200" ......."invalid_checksum":0,"no_flow":0,"syn":1044,"synack":454,"r <- alway end like thisexample coming from eve.json
{"timestamp":"2020-07-17T10:35:00.974605+0200".......<{"expectations":0},"flow":{"memuse":8443384}}}}} <--- good output -
problem solved, i need to increse this
sysctl -w net.local.stream.recvspace=16384
sysctl -w net.local.stream.sendspace=16384now i see data on my grafana
̿' ̿'\̵͇̿̿\з=(◕_◕)=ε/̵͇̿̿/'̿'̿ ̿
Please do not use chat/PM to ask for help
we must focus on silencing this @guest character. we must make up lies and alter the copyrights !
Don't forget to Upvote with the 👍 button for any post you find to be helpful. -
@kiokoman said in Suricata-5.0.3 Package Update -- Release Notes (pfSense-2.5 DEVEL):
problem solved, i need to increse this
sysctl -w net.local.stream.recvspace=16384
sysctl -w net.local.stream.sendspace=16384now i see data on my grafana
Ah-ha! It was truncating the stream. FreeBSD has so darn many system tunables ...

-
@kiokoman said in Suricata-5.0.3 Package Update -- Release Notes (pfSense-2.5 DEVEL):
problem solved, i need to increse this
sysctl -w net.local.stream.recvspace=16384
sysctl -w net.local.stream.sendspace=16384now i see data on my grafana
Added a section to my initial RELEASE NOTES post detailing the need to check and probably adjust these system tuneables. Thanks for the investigation and feedback!
-
it will also be added to the README of the plugin https://github.com/influxdata/telegraf/issues/7843
-
@kiokoman said in Suricata-5.0.3 Package Update -- Release Notes (pfSense-2.5 DEVEL):
it will also be added to the README of the plugin https://github.com/influxdata/telegraf/issues/7843
