Status: Monitoring is completely broken, pfSense 2.4.5
-
@johnpoz said in Status: Monitoring is completely broken, pfSense 2.4.5:
@Gertjan @jimp oh I think maybe you guys took that wrong... I mean that in this context that its problematic to also have that variable at play... When your trying to figure out something in a gui having issues.
And your tools are just 1 long flood of hsts errors - that is problematic for troubleshooting ;)
If your not having any issues sure common security practices should be default... Should of worded that better... I meant that since its not public, there is no "concern" with turning it off for testing..
I bet they knew what you meant, but they just took advantage of a rare opportunity to jack you up a little bit ...
 .
. -
Can anyone comment on the apparent smoking gun bug I found in the loaded, running JavaScript?
-
Sure many people would - if they could actually duplicate it... Which I can not.
Tried multiple time frames from the dropdown, custom time frames.. All display just fine.
-
To remove any shadow of a doubt, I fixed my certificate so that there are no warnings given by the browser and no exception is required. Still, the same bug persists.
-
If you are the only one seeing the issue, then its something unique to your setup/config/devices that is not actually a bug.. If it is - its very isolated to specific XYZ that all have to fall into place.
Your currently running 2.4.5p1?
You have done a clean install, and your still seeing the problem? Then why are the boards not flooded with people reporting the same problem? It's not like the monitor page is some buried odd ball thing that only 0.1% of users use ;)
Are you running some browser addons? Have you tweaked your setup in some fashion? I would love to be able to duplicate your issue.. But have tried all kinds of things and it just works as it suppose to..
To me a bug is something when you do X, it doesn't do what it suppose to, or it does it in a fashion its not suppose to.. It really needs to be repeatable for anyone to look into what is causing it.
-
I was able to perform open heart surgery on the running PHP in Firefox's F12 pane and get it to work successfully.
I did this by setting a breakpoint at line 1141 of
status_monitoring.phpand then going to console and enteringvar timeFormat = "%m/%d %H:%M". I chose this value because it matches thetimeFormatfor a time resolution of3600as seen in thetimeLookupdata structure, which is close to mydata[0].stepvalue of7200. Then, I unpaused from the breakpoint and it just worked like normal.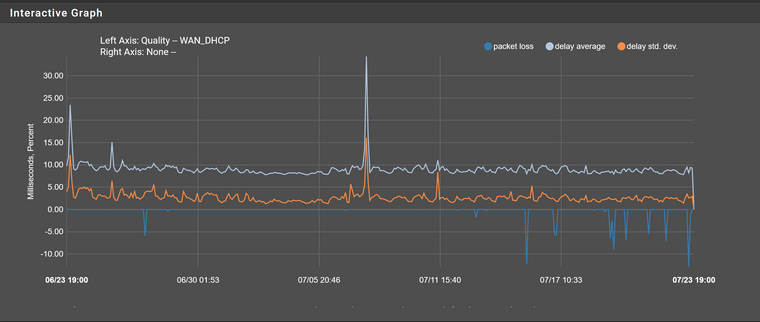
Here's what the
datavariable contains, you can see the problematic7200value there.
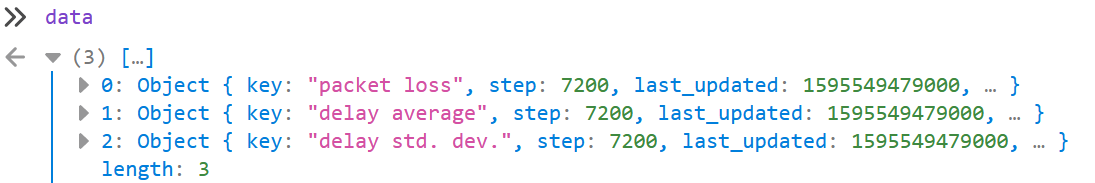
I tried to follow back the
datavariable and see where it came from, but it ends up in what looks like some PHP anonymous function call or something that I don't understand. I'm pretty sure it's a representation of the data from the .rrd file itself. I'm not sure if the value comes from the .rrd file itself or from the tool that parses it, though.(Side note: I just realized that I was previously referring to the PHP as JavaScript. Shows what I know...)
-
The POST involving
rrd_fetch_json.phpseems to have the expected resolution of3600. So I think something funny is happening insiderrd_fetch_json.php. Not positive, though.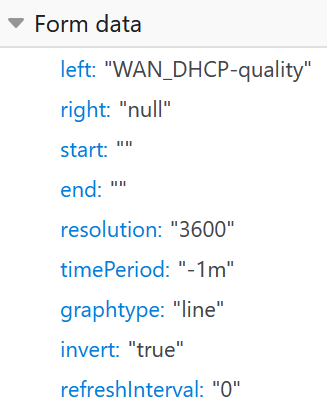
-
Figured out where the problematic value of
7200was coming from. It's from the RRD file itself when queried in rrd_fetch_json.php line 168 with therrd_fetch()function and the options deriving from the POST data I attached in a picture above. I constructed therrdtool fetchcommand that should result from that POST data and ran it on the command line against the file directly:me@my-machine:~/pfsense$ rrdtool fetch rrd/WAN_DHCP-quality.rrd AVERAGE -r 3600 -s now-1m+1hour -e 1595460745-1hour loss delay stddev 1592978400: 0.0000000000e+00 1.5691636408e-02 6.2196527951e-03 1592985600: 0.0000000000e+00 9.1416309671e-03 2.7422781960e-03 1592992800: 0.0000000000e+00 8.8436429234e-03 2.5432010581e-03 1593000000: 2.6234902083e-02 9.2394222539e-03 3.5694343962e-03 1593007200: 5.2510052500e-02 1.0458579000e-02 4.6231059930e-03 1593014400: 0.0000000000e+00 1.0825514267e-02 4.7963684750e-03 <snip> 1595419200: 0.0000000000e+00 8.0070629420e-03 1.7023876495e-03 1595426400: 0.0000000000e+00 8.5285815145e-03 2.3826874231e-03 1595433600: 7.1014380729e+00 8.6965289475e-03 2.7509416831e-03 1595440800: 4.1289524583e-02 8.8894945167e-03 2.6180607746e-03 1595448000: 6.1264454861e-02 8.7516545776e-03 2.4379814676e-03 1595455200: 0.0000000000e+00 8.6976092202e-03 2.6467615867e-03 1595462400: -nan -nan -nanThe values to the left of the colons are some kind of timestamp in seconds. If you look at the difference between them, you'll see it's 7200. I believe
rrd_fetch()function is using that difference to determine astepproperty for the result that is used on line 174 . Later, this data is referenced asdata[0].stepon line 1139 ofstatus_monitoring.phpas shown in my post from 2 days ago and the problem occurs when there's no matching key intimeLookup.So, here we have traced the problem all the way back to the RRD file itself. Looks like this potential step size was not anticipated and so was not included in the
timeLookuparray. My firewall has been running for 6 years, so maybe that length of time has something to do with it? Resolution has decreased as things filled up? I don't know. The good news is that it appears the fix is as easy as adding a line totimeLookupto account for it. Either that or diving really deep into RRD tool or the place where RRD tool is invoked to create the files and figure out if anything there could be causing it. I don't plan on doing that. -
The
rrdtool fetchdocumentation even describes that the resolution argument may not be honored. That's what's happening here. We asked for resolution 3600, but it's not honored.--resolution|-r resolution (default is the highest resolution) the interval you want the values to have (seconds per value). An optional suffix may be used (e.g. 5m instead of 300 seconds). rrdfetch will try to match your request, but it will return data even if no absolute match is possible. -
Hello!
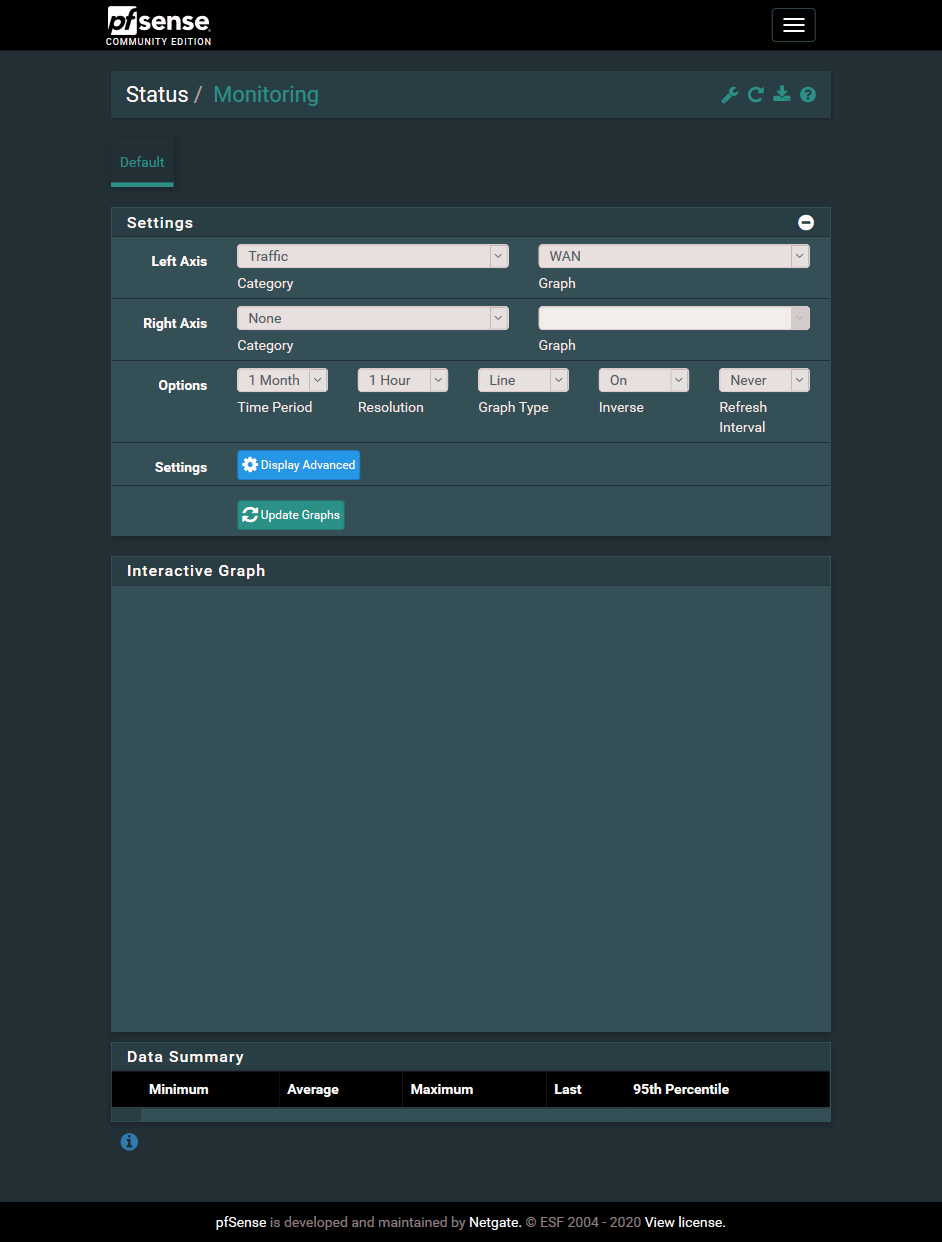
Have you tried resetting your rrd data using the "Reset Data" button in Status -> Monitoring -> Settings, or with "/bin/rm /var/db/rrd/*" ?
John
-
@serbus No, because I want to keep my data.
-
@scurrier said in Status: Monitoring is completely broken, pfSense 2.4.5:
A long time ago I might have tried changing the RRD settings to retain more data points or something. Not sure, hard to remember.
Hello!
You could try backing up the /var/db/rrd folder and then resetting.
Maybe just manually popping the rrd file for the interface/dataset that if giving you problems.
Retaining the data may not be worth it if you cant display it the way you want to, but maybe there is an easy code workaround.John
-
@serbus I think you're right it will probably fix it. I'm not going to do it now, but may decide to try tomorrow. Regarding potentially having changed the rrd settings, is there even a place to do that in the gui? I'm not the kind to go screwing under the hood.
-
Hello!
I dont know if there are rrd tweaks in the gui.
There is a RRD Data option in Diagnostics -> Backup & Restore that could simplify saving and recovering your data if you want to fool around with it.
John
-
rrd files can be modified .
No GUI, as you're dealing with pure data chunks.
pfSense has the tool.rrdtool dump /var/db/rrd/lan-traffic.rrd /root/lan-traffic.xmlNow edit this xml file using your favorite editor.
When done :rrdtool-f /root/lan-traffic.xml /var/db/rrd/lan-traffic.rrd -
It looks like the answer has been found. It can be considered a bug, but a very obscure one that requires unusual circumstances to trigger -- namely a very, very large rrd dataset (the OP says his is 6 years old). It very well could be something rrd is doing internally once the dataset file reaches a certain size. Since that is an unusually large dataset, the other folks in the thread are unable to reproduce using their likely smaller datasets.
@scurrier: what size is your rrd file? Have you been running on the same hardware the entire 6 years? Just wondering if you do in fact have 6 years worth of data in a single contiguous file.
@scurrier: take the info you have collected, and the solution you found, and submit an official bug report on the pfSense Redmine site here: https://redmine.pfsense.org/. That will put it on the developers' plate for future work. If you have already submitted a bug report, please edit it if necessary and include all the information you collected in your posts above. That will be of great value to whomever works on the bug report.
-
6 years is a lot of data for what type of data it is.. Does that really make sense to keep the data for that long?
I just looked and mine goes back to dec 2017.. I would assume when I fired up this 4860.. But when moved to new hardware I wouldn't be bringing that data over..
While its great info for sure, but I doubt the bug report would get much looking into until someone is sitting around twiddling their thumbs - hmm, hmm what to work on ;)
A quick fix I would think would just be to truncate rrd data at X.. So it only ever goes back so far, or so many specific data points..
But yeah @scurrier great work on tracking it down..
-
There's a quick and easy version of a fix so maybe I will try to figure out which git branch to work from and submit a pull request on it that mimics the open heart surgery I did in the browser.
-
Looks like I've been running this firewall since the end of 2014.
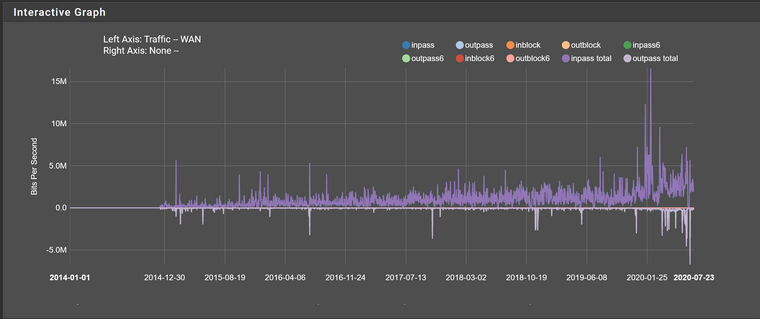
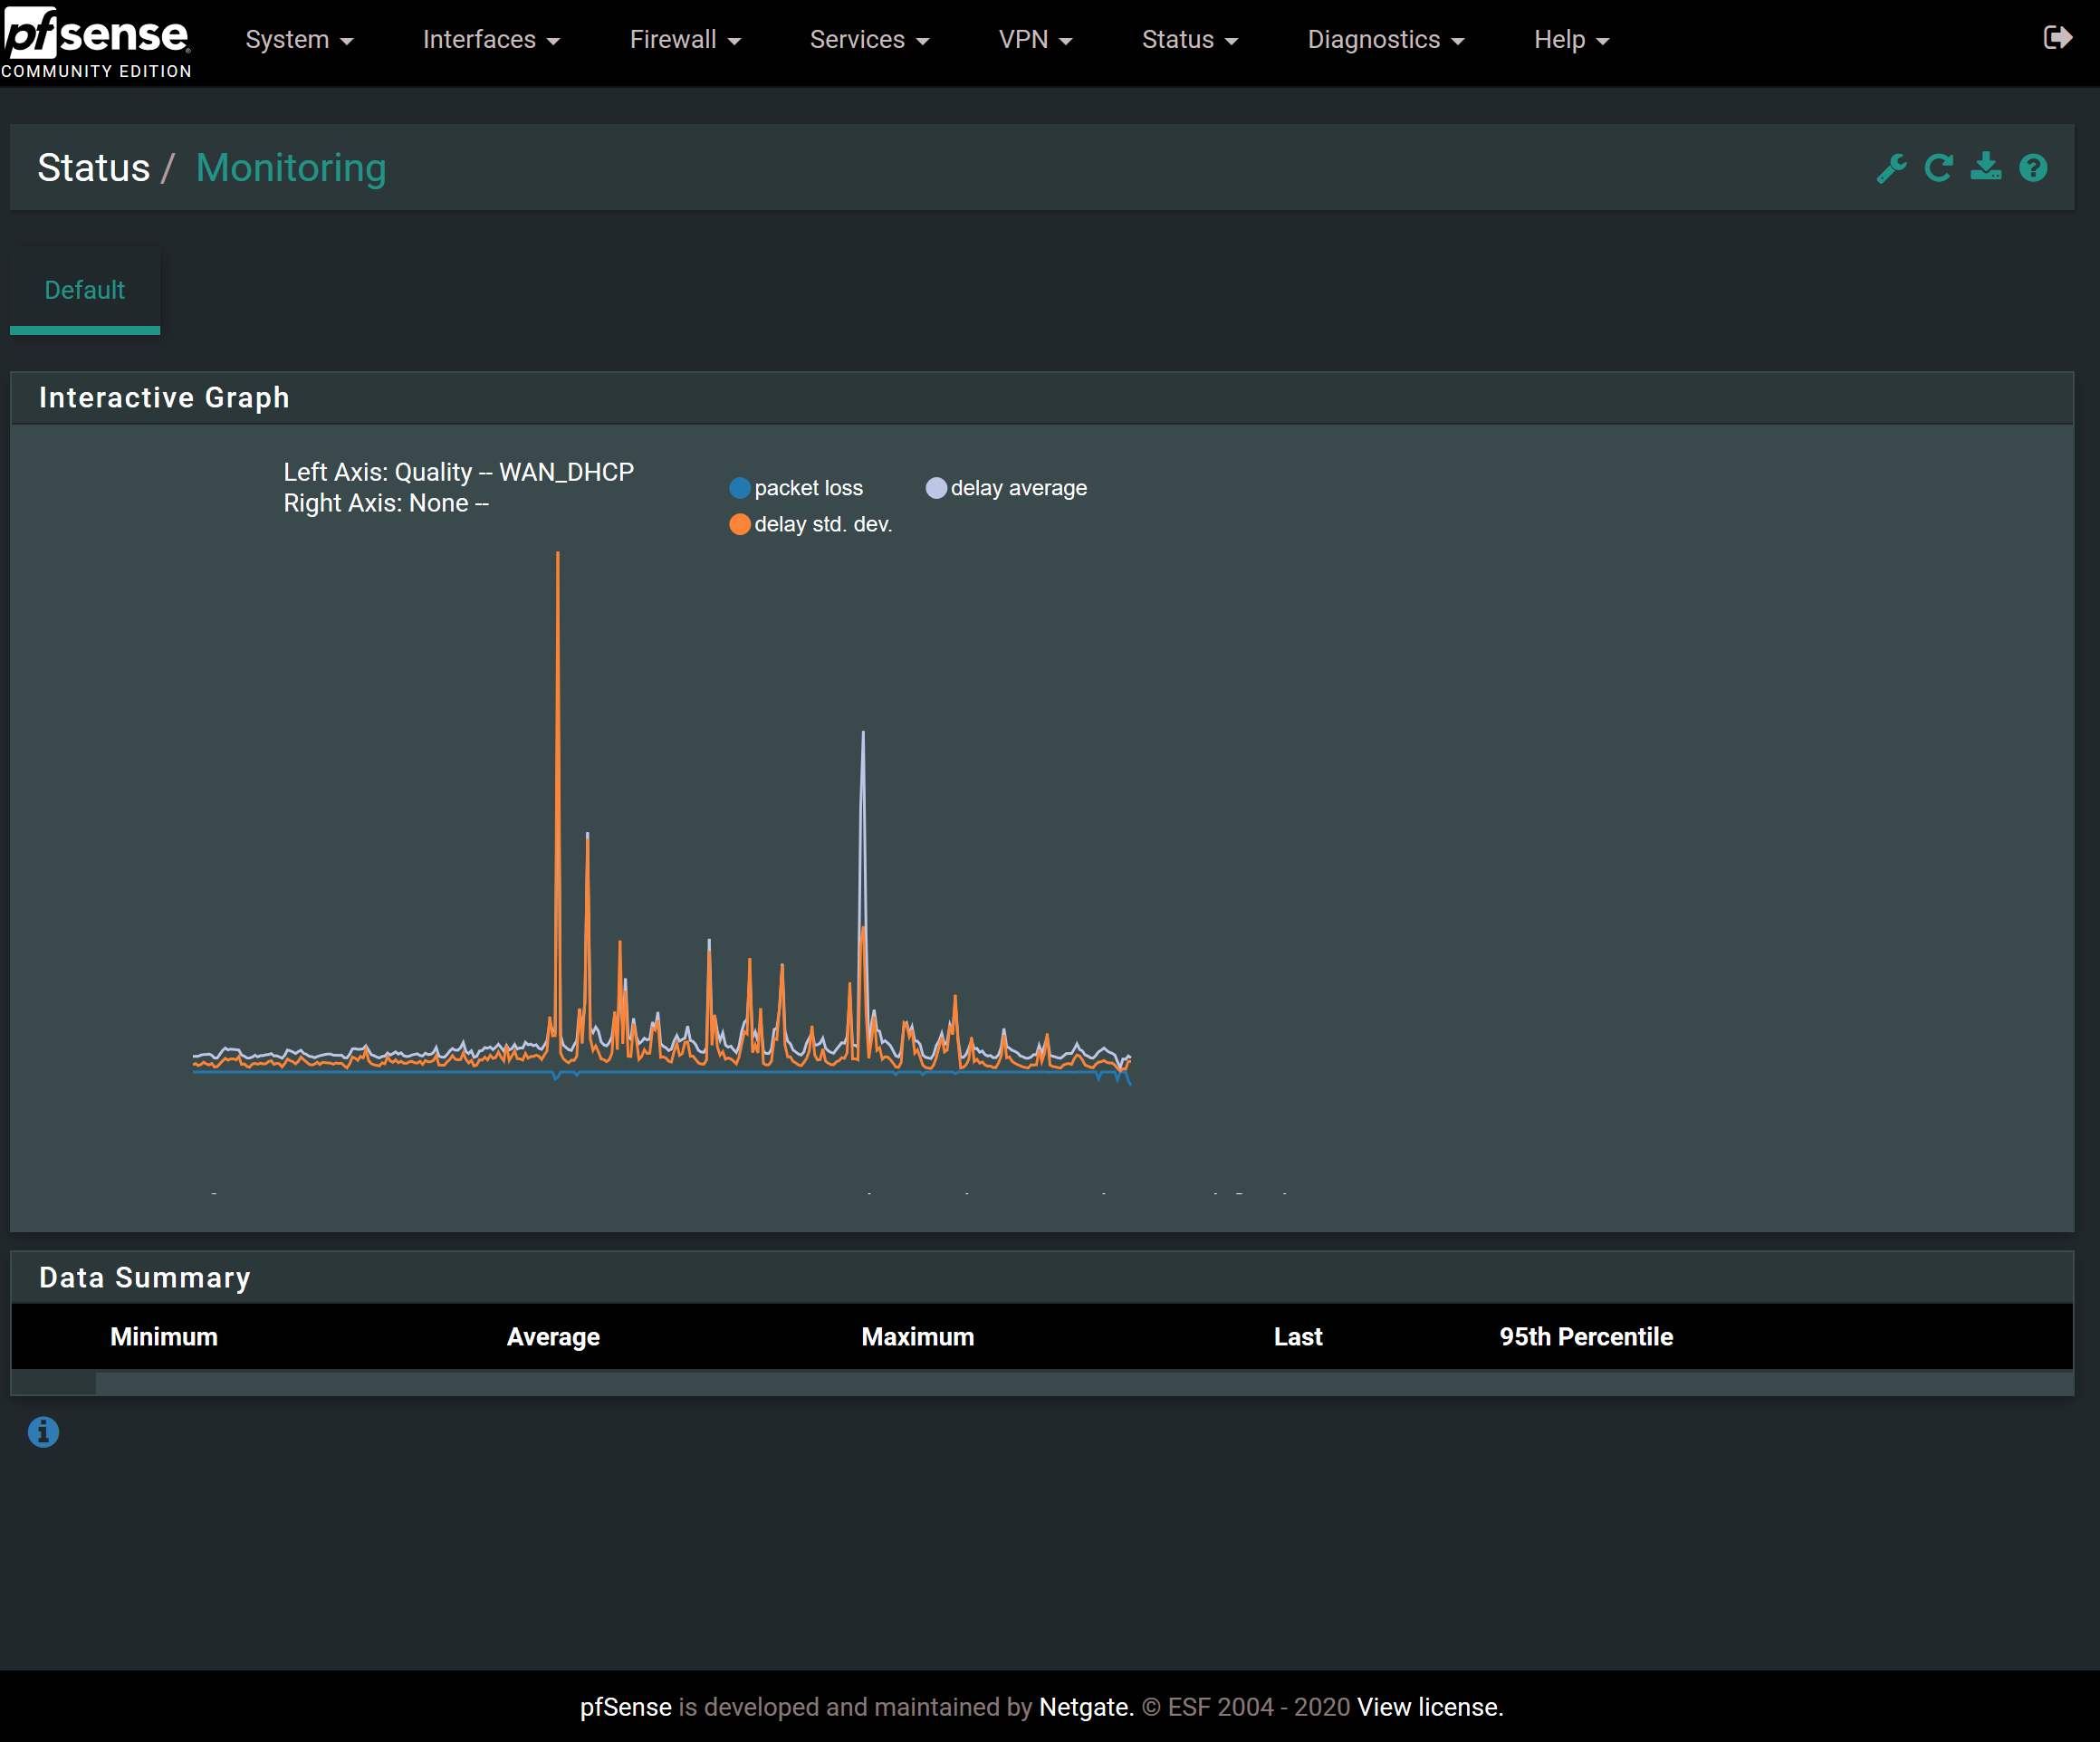
Interestingly, the data for some metrics doesn't go back as far as others. Compare these two. Note that the first one shows nulls for part of the data even though I know the firewall was running at that time. I wonder why.
-
@scurrier said in Status: Monitoring is completely broken, pfSense 2.4.5:
I wonder why.
Have a look at the the folder where rrd files are stored. Maybe you used another type of WAN interface before, like a pppoe access - or static setup. The rrd file will have another name for that period.
Btw : didn't know that that much data is stored in a rrd file :
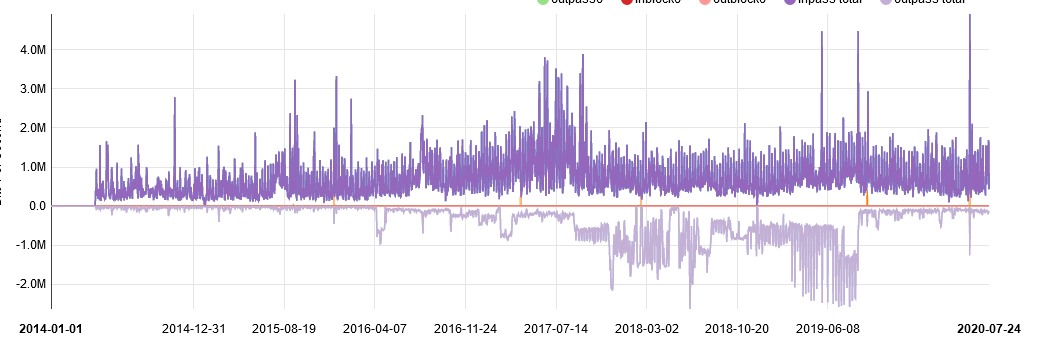
mine goes back to 2014 also.
The file that was just before that time was based on a pppoe access, I wiped that stale rrd file long time ago.edit :
IPv6 since 2014 also :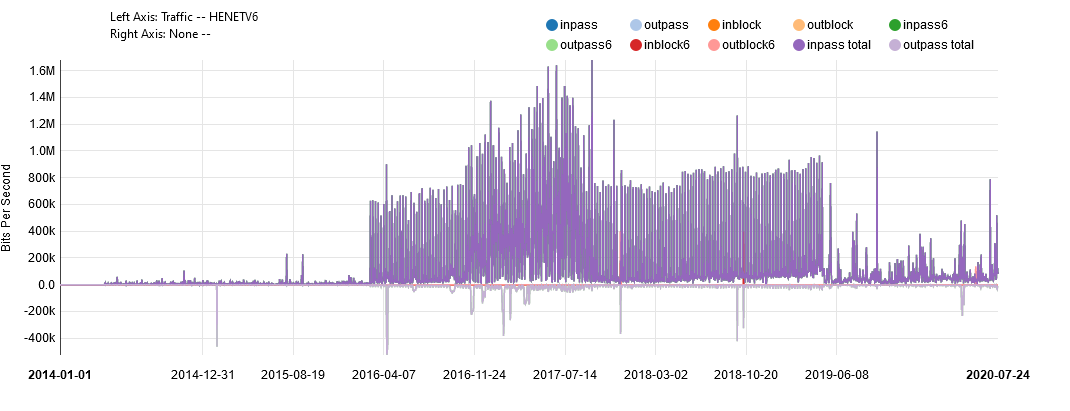
The big chunck was the period I tried to sync my Syno NAS with some Microsoft Office cloud over night. I'll try that again when fiber gets invented.