Which device sent so much to where ?
-
ntopng and or netflow should for sure be able to show you that. Other options would be the darkstat package, the bandwidthd package.
https://docs.netgate.com/pfsense/en/latest/monitoring/monitoring-bandwidth-usage.html
-
@johnpoz
Hi, thanks for your answer.
Well, as I wrote, ntopng cannot give me a clear view of which device uploaded 4gb at 2:13am, so netflow won't too.
But if you were able to get such info, let me know cause perhaps I misunderstood something in ntopng community edition.
Cheers -
Or : no packges at all : Status > Traffic Graph will do.
Select LAN, Bandwith out, Local and hostname.
You'll be seeing network resource consumer shortly.Which means you have to VPN-in at around 2:13 AM to actually see what device is sending all this traffic.
Probably some device backup up to a cloud based drive. -
@Gertjan
Thanks for your answer.
realtime is ok. but now it's 3:20PM, and I would like to get this info afterwards, otherwise, too easy :) -
I'm curious what exactly your looking for? That you say ntopng doesn't do?
I can look at ntop, at say 2:13 am this morning - and see who the top talkers where at that time, I can then look at that host data peers and see where all the data went..
If your trying to call up historical flows... No I don't think that is possible.. But I can for sure look into who was sending a bunch of data at 2:13, etc. When you come in at say 9..
But you can for sure export the flows to some other collector that would allow you to view historical data like that.
You can also look into the bandwidthd package.
-
hello, and thanks,
another newbie, using sg-1100.i want to montior data transfer on my home server running emby.
there are so many packages for pfsense and i am a little confused.as per your suggestion, i installed ntop, enabled it and when i try to goto the web interface, which is https://192.168.62.1:3000/
i get 'problem loading pagei did a port scan on my sg-1100, on ports 22, 53,80,443 are open.
any advice would be most appreciated.
-
@johnpoz
Hey, thanks for your answer and your time.So I saw this, but I'm not really satisfied, and some feature are available only in NtopNG Enterprise edition
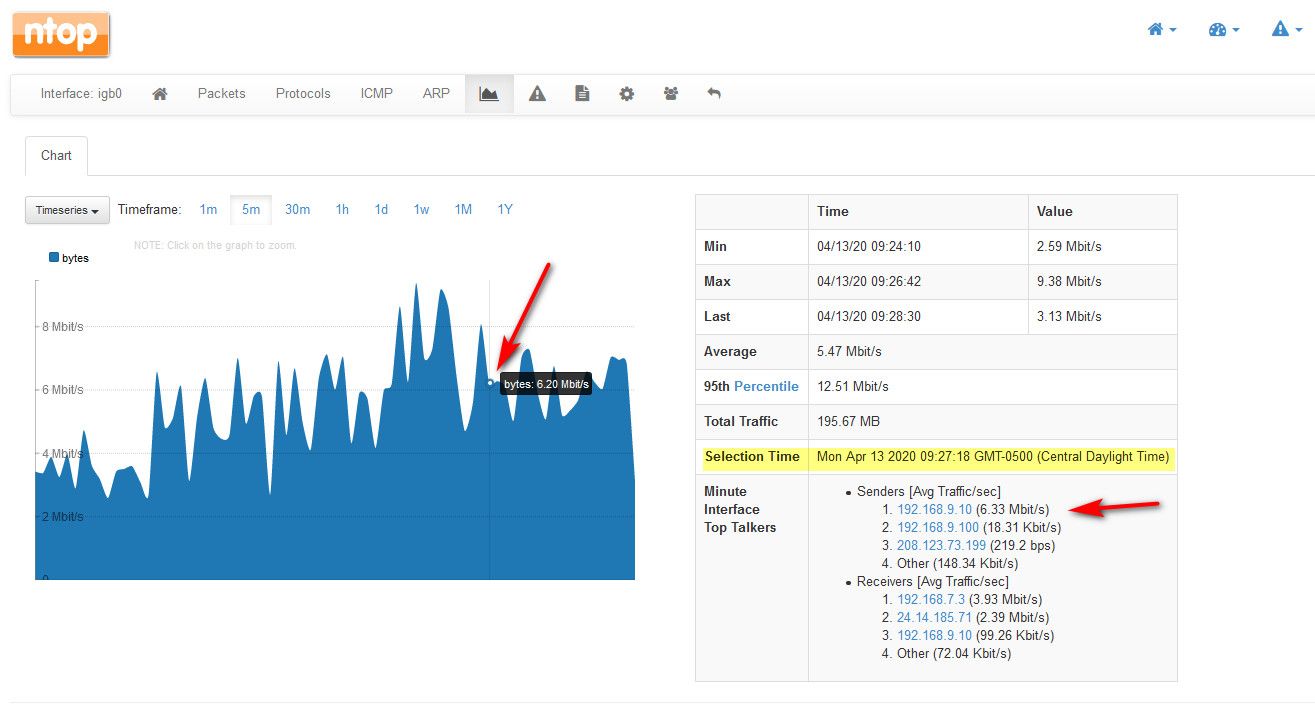
I'll explain why based on the screenshot you shared :- difficult to navigate, but i'm just not used to this interface
- speed vs volume : i'm not interested in speed, only volume for an historical data mining approach. Speed is required for live analysis.
- "195.67MB", is it DL or UL ? and which device sent so much (we can exfiltrate info using little bandwidth to not generate realtime alerts)
I would like to be able to say "at 2:13, my ipad sent 4GB to apple servers (for icloud backup)"
I know ntopng free has not all features, so looking for external tools.
As SoftflowD is not really maintained, and nprobe is not free, I'm trying to find a solution.... -
@ethicker said in Which device sent so much to where ?:
I would like to be able to say "at 2:13, my ipad sent 4GB to apple servers (for icloud backup)"
To your speed vs volume... Its a given that your ipad is not going to send 4GB at 2:13.. Its going to take time - which will = rate of transfer... To move 4GB of data in any reasonable amount of time its going to have to be a pretty high rate ;)
So when you look at the graph at 2:13 time frame - you would see your ipad as one of the top talkers to create the rate. Looking at this ipad IP... you would be able to see where he sent data, so you would see the 4GB of data as a transfer to your backup server.
If what to see how much data each IP sent in a day, week, month, etc.. That you prob want to look at bandwidthd..
As to get what you want "free" yeah that is a difficult question, off the top don't know anything that will give you the features your looking for for free.. You could always buy a enterprise license of ntopng and host it on a different machine. And then just send it the flows.
-
I definitely agree on volume / time / bandwidth.
The issue is nprobe is not free, but I saw an option to send flows to an ELK.
In the meantime, trying scrutinizer, elastiflow and others.
But at least, I know what i'm looking for is not embedded in Pfsense.In the meantime, if someone has a good idea :)
-
This post is deleted!