Traffic Graph display issue - showing 1/2 of actual bandwidth at times
-
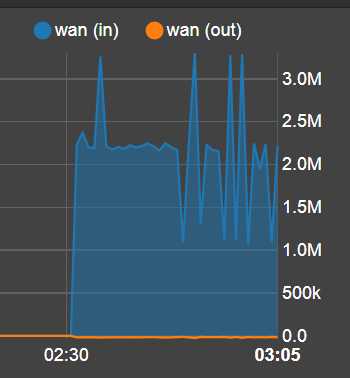
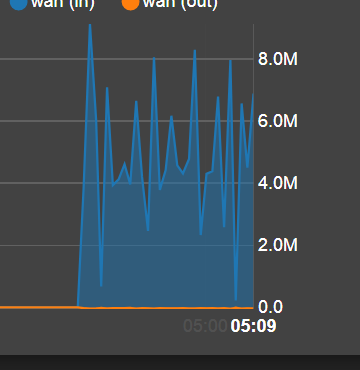
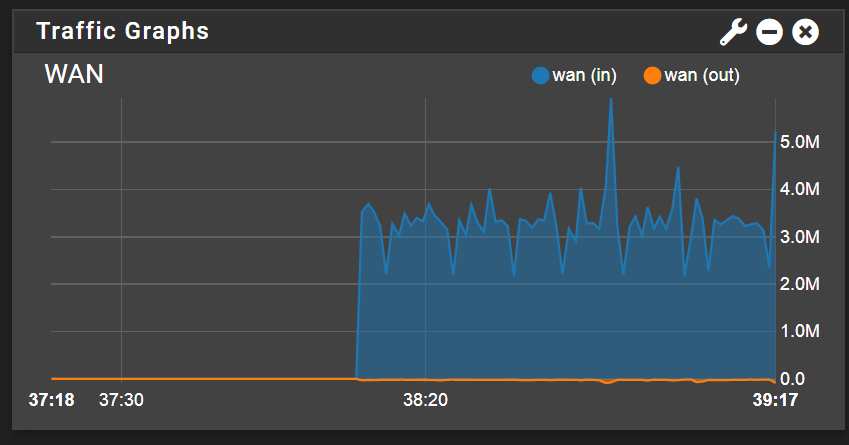
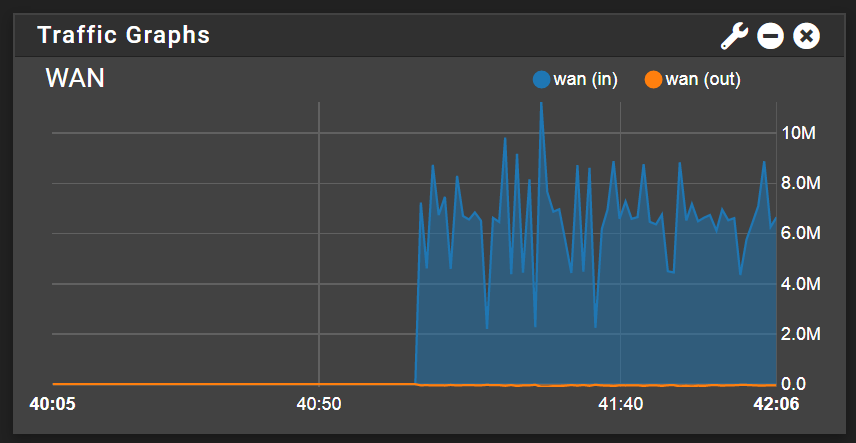
Good morning. I'm seeing a minor display issue on the 2.5.0 Dashboard. I am streaming some TV now, and the graph display seems to show 1/2 the bandwidth being used. Actual BW is ~6 Mbps average, but the graph display sometimes shows ~3 Mbps, other times ~6. Certainly not a critical case for me anyway, but thought you might be interested. Some screenclips below. "Status/Traffic Graph" also seems to display the same behavior. Single home user here, single device streaming, plus this web session only.
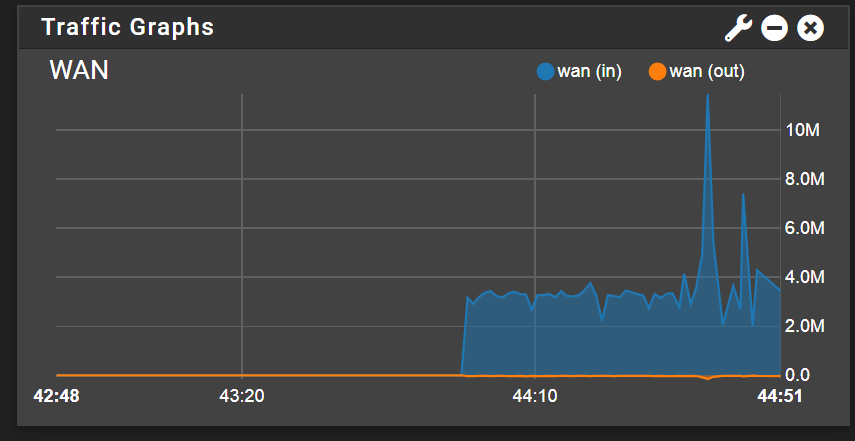
-
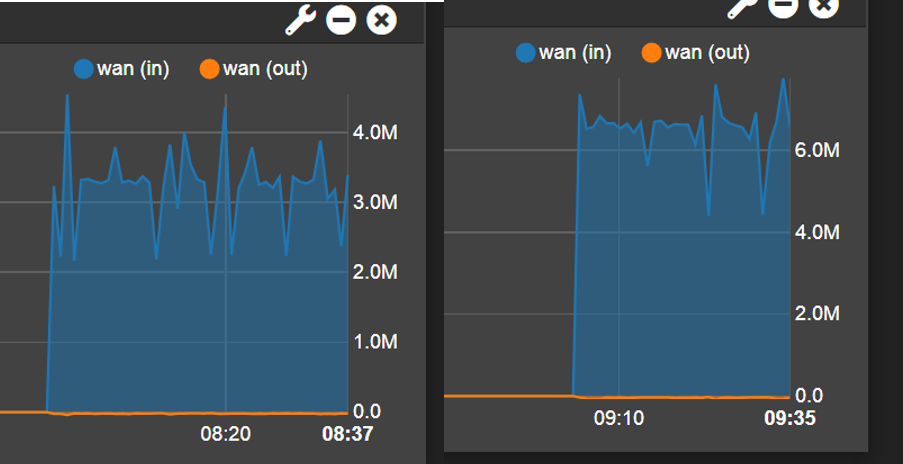
So I guess no one sees this happening? Displaying 1/2 real BW, then displays correctly after refreshing the page? Same streaming traffic, seconds apart.
-
"Half" seems new. I've seen posts in the past about "twice" the actual bandwidth in places, and at least in 2.4.5 saw that myself in Status/Queues if traffic shaper is on. Do you have any packages installed, maybe Snort?
-
@teamits
Thanks for the reply. No to Snort. Home user, so it's just me. No torrents or anything, just my streamer box and the stuff I'm typing on. 6 Mbps is what I have calculated my streaming uses. I can watch a channel, the graph displays 3Mb, refresh displays 6Mb. No other changes. It's not like it's bursting. When I see a burst, like when changing channels, if it's currently showing 3Mb, it will burst to 15Mb. If it's showing 6Mb, it bursts to 30Mb. More of a curiosity than a fatal flaw.Packages : Cron, Iperf, Mailreport, Notes, Nut, OpenVPN, pfBlockerNG-devel, RRD_Summary, Service Watchdog, System_Patches
Ps - No shaping. I used to use it when I was seeing if I could scrape by on a slower plan, but that's gone and a fresh install of 2.5 in it's place.
These clips taken back to back with a refresh in between.
