Is this an Asymmetric Routing routing issue?
-
Yes, I can see that the traffic is going out on pfsense, but not coming back to the client:
14:19:58.625064 IP 192.168.30.99.53151 > 192.168.40.17.22: tcp 0
14:19:59.624594 IP 192.168.30.99.53151 > 192.168.40.17.22: tcp 0
14:20:01.624796 IP 192.168.30.99.53151 > 192.168.40.17.22: tcp 0
Note: Above I have changed the LXC Container's IP to
17(instead of9). This also has no effect.This is how it looks like for the other service on
.8, successfully connecting ssh:14:28:40.372431 IP 192.168.40.8.22 > 192.168.30.99.53285: tcp 0 14:28:40.375857 IP 192.168.40.8.22 > 192.168.30.99.53285: tcp 452 14:28:40.383526 IP 192.168.30.99.53285 > 192.168.40.8.22: tcp 0 14:28:40.383573 IP 192.168.30.99.53285 > 192.168.40.8.22: tcp 16You don't have some rules on the 30 vlan or floating that could be doing anything weird with that IP? Say policy routing?
To view tags in sniffing traffic on pfsense you would need to use cmdline on pfsense with tcpdump -e
one sec and put up an example... sniffing on one of my interfaces with vlans on it.. BRB
I have checked rules for the VLAN 30 (and 40) over and over - but no, I do not see anything interfering here.
I'll check with
tcpdump -e! Thank you.My time is running out today.. will report tomorrow if I got further.
-
Ok you don't actually have to do it via cmd line... If you enable promiscuous mode, and sniff on the parent interface.. You can do it easier just from the gui, and then for easy reading just download and open with wireshark.
example
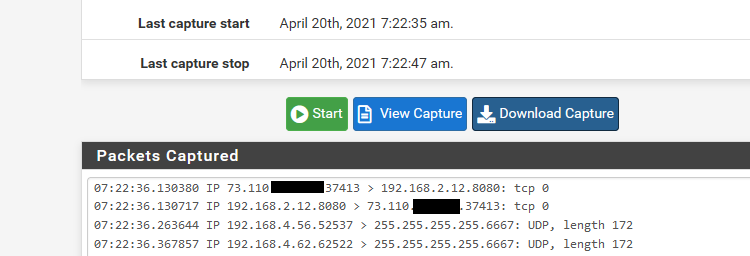
And here in wireshark
You can see traffic on the 192.168.4 network is tagged with vlan id 4, and traffic on the 192.168.2 is native an untagged.. Both of these networks are on my igb2 interface.
But if you are seeing traffic going out of pfsense and tagged correctly, then no it has nothing to do with pfsense.
edit: hiding that 73.x address - that is my son's connection. His unifi stuff talks to controller on my network.
you will want to make sure you look at outbound traffic from pfsense for your vlan tag, and that sending to whatever mac this .9 is actually at.. That is inbound traffic into mine.. But just an example of seeing the tags. You can see if you are seeing an answer, but maybe the answer is not tagged? Or tagged wrong, etc.
-
@johnpoz
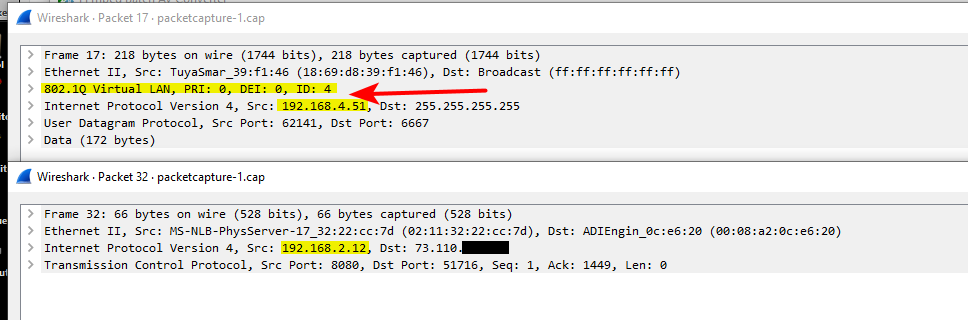
Nice, thanks! I did not know that I can do all of this. And I am really feeling I need to read into packet captures, sniffing etc.. But the cap collected in pfsense with promiscous looks different in wireshark:

-
Yeah if there is no answer you will see retrans.. Thought your problem child was .9?
But if click into a specific packet you should see the tag, like my example.
edit: Maybe you have to enable to show 802.1q in the dissector.. Let me check my wireshark settings. I use wireshark a lot, so might have turned it on long time ago..
-
@johnpoz
Yes, half an hour ago I changed the LXC Container's IP to17, to see if it has any effect: No, it doesn't. Same problem. Can reach.8, but cannot reach.17(both on the same vmbridge in Proxmox). I can even reach a third container, with a different subnet VLAN (60instead of40).. -
Well if your seeing the traffic go out, and its tagged correctly and to the right mac.. It has zero to do with pfsense..
You don't have any static mac setup in pfsense do you.. Maybe you setup static arp for that mac, and its changed?
-
@johnpoz said in Is this an Asymmetric Routing routing issue?:
Maybe you setup static arp for that mac, and its changed?
I do have static ARP/MAC - the container gets its IP using DHCP and this is assigned based on MAC. However, checked and MAC is Ok (and I can also reach the container from pfsense/OpenVPN, or from the Management LAN
10, just not from the vlan30).I am out now today. Many thanks so far, this is really helpful and, while I am not yet further with my problem, I am learning a lot!
-
@helmut101 said in Is this an Asymmetric Routing routing issue?:
just not from the vlan 30).
That sure doesn't make any sense.. You sure you don't have a firewall this thing your trying to reach, or odd routing for 30 network on your dest device? So nothing in 30 can talk to it, but 30 can talk to other devices in the 40 vlan..
Can you sniff on 40.17 and validate it actually sees the traffic?
-
@johnpoz said in Is this an Asymmetric Routing routing issue?:
ewall this thing your trying t
Yes, tomorrow I have a bit more time. I will look into this carefully and test more siffing at different points, including the VM itself. Will report back.
If it wasn't that strange I would have not written here.. I was working on this issue for 4 days so far.
-
Alright, so this will get long.
TL;DR
I currently do not know why, but on the specific Host, there was/is a bridge ethernet link / virtual nic configured that forwarded outgoing routes to the wrong subnet (192.168.16.0) - I have never heard of this subnet and I don't know why this ip/bridge/link ended up there.
I solved the issue (for the moment) with:
ifconfig br-985a84259068 downBut: Once the VM is restarted, the bridge appears again. I am still working on this.
Sleuthing (long)
This was a long walk down the rabbit hole. But I'll write here, perhaps someone else will find any of the commands useful for similar catch the rabbit tasks.
Here's setup for testing:
-
60 is my IOT subnet
-
40 is my Sevrice subnet
-
30 is my Consumer subnet
-
Client
30.11, where 30 is the subnet/vlan and 11 the IP -
Host
40.17, issue getting reached from subnet 30 clients -
Host
40.8no issue getting reached, can reach40.17 -
Host
60.10no issue getting reached, can reach40.17
This already is really strange. In addition, I could reach
40.17just
fine from pfsense (ping) and when connected through OpenVPN.1. Check Routing
- On VM
40.17
ip routedefault via 192.168.40.1 dev eth0 172.17.0.0/16 dev docker0 proto kernel scope link src 172.17.0.1 172.23.0.0/16 dev br-5acdb2ca8271 proto kernel scope link src 172.23.0.1 linkdown 172.28.0.0/16 dev br-2d547cdc7389 proto kernel scope link src 172.28.0.1 192.168.16.0/20 dev br-985a84259068 proto kernel scope link src 192.168.16.1 192.168.40.0/24 dev eth0 proto kernel scope link src 192.168.40.17The default route looks fine, but why are there other routes?
Compare output to other Host
40.8without issues:default via 192.168.40.1 dev eth0 192.168.40.0/24 dev eth0 proto kernel scope link src 192.168.40.8The
172routes may be explained with Docker running on40.17,
but192.168.16.0/20looks strange.2. Checks Packets (tcpdump)
Now, as suggested, check whether packets really arrive at the host.
40.17:
tcpdump 'host 192.168.30.11 and port not 22'30.11:
ping 192.168.40.17Output (tcpdump):
01:50:58.811226 IP 192.168.30.11 > 192.168.40.17: ICMP echo request, id 1221, seq 1, length 64
01:50:59.816840 IP 192.168.30.11 > 192.168.40.17: ICMP echo request, id 1221, seq 2, length 64
01:51:00.820305 IP 192.168.30.11 > 192.168.40.17: ICMP echo request, id 1221, seq 3, length 64
01:51:01.823602 IP 192.168.30.11 > 192.168.40.17: ICMP echo request, id 1221, seq 4, length 64
01:51:02.827368 IP 192.168.30.11 > 192.168.40.17: ICMP echo request, id 1221, seq 5, length 64
01:51:03.831271 IP 192.168.30.11 > 192.168.40.17: ICMP echo request, id 1221, seq 6, length 64They arrive, but: nothing is returned.
Verify/compare to output of the same commands on working host 40.8:
01:49:39.460155 IP 192.168.30.11 > 192.168.40.8: ICMP echo request, id 1217, seq 1, length 64
01:49:39.460184 IP 192.168.40.8 > 192.168.30.11: ICMP echo reply, id 1217, seq 1, length 64
01:49:40.461106 IP 192.168.30.11 > 192.168.40.8: ICMP echo request, id 1217, seq 2, length 64
01:49:40.461133 IP 192.168.40.8 > 192.168.30.11: ICMP echo reply, id 1217, seq 2, length 64
01:49:41.461886 IP 192.168.30.11 > 192.168.40.8: ICMP echo request, id 1217, seq 3, length 64
01:49:41.461918 IP 192.168.40.8 > 192.168.30.11: ICMP echo reply, id 1217, seq 3, length 643. Check routing
At this moment, I was pretty sure to have the issue isolated to the Host
40.17itself.
Something is going on with the routing.on host
40.17:ip route get 192.168.30.11192.168.30.11 dev br-985a84259068 src 192.168.16.1 uid 0
cacheuh?
compare on working host
40.8:ip route get 192.168.30.11192.168.30.11 via 192.168.40.1 dev eth0 src 192.168.40.8 uid 0
cacheWhy is outgoing traffic routed through a bridge called
br-985a84259068to subnet192.168.16.1?on
40.17:
Check:cat /etc/network/interfacesauto lo
iface lo inet loopbackauto eth0
iface eth0 inet dhcpok.. further check routes
apt install net-tools
route -n
Kernel IP routing table
Destination Gateway Genmask Flags Metric Ref Use Iface
0.0.0.0 192.168.40.1 0.0.0.0 UG 0 0 0 eth0
172.17.0.0 0.0.0.0 255.255.0.0 U 0 0 0 docker0
172.23.0.0 0.0.0.0 255.255.0.0 U 0 0 0 br-5acdb2ca8271
172.28.0.0 0.0.0.0 255.255.0.0 U 0 0 0 br-2d547cdc7389
192.168.16.0 0.0.0.0 255.255.240.0 U 0 0 0 br-985a84259068 <--- What is this??
192.168.40.0 0.0.0.0 255.255.255.0 U 0 0 0 eth0Study what are network bridges:
https://wiki.archlinux.org/index.php/Network_bridge
https://tldp.org/HOWTO/BRIDGE-STP-HOWTO/set-up-the-bridge.htmlbridge link8: vetha2e5a47@if7: <BROADCAST,MULTICAST,UP,LOWER_UP> mtu 1500 master br-2d547cdc7389 state forwarding priority 32 cost 2
10: vethcd0643c@if9: <BROADCAST,MULTICAST,UP,LOWER_UP> mtu 1500 master br-985a84259068 state forwarding priority 32 cost 2 <-- Here it is
14: veth992d5b3@if13: <BROADCAST,MULTICAST,UP,LOWER_UP> mtu 1500 master br-2d547cdc7389 state forwarding priority 32 cost 2
16: vethb6721a9@if15: <BROADCAST,MULTICAST,UP,LOWER_UP> mtu 1500 master br-2d547cdc7389 state forwarding priority 32 cost 2
18: veth7dfb21f@if17: <BROADCAST,MULTICAST,UP,LOWER_UP> mtu 1500 master br-2d547cdc7389 state forwarding priority 32 cost 2
20: vethc3562b4@if19: <BROADCAST,MULTICAST,UP,LOWER_UP> mtu 1500 master br-2d547cdc7389 state forwarding priority 32 cost 2
22: veth9017e4e@if21: <BROADCAST,MULTICAST,UP,LOWER_UP> mtu 1500 master br-2d547cdc7389 state forwarding priority 32 cost 2apt install bridge-utils brctl show br-985a84259068bridge name bridge id STP enabled interfaces
br-985a84259068 8000.02428b97932d no vethcd0643c <-- Here, tooifconfigvethcd0643c: flags=4163<UP,BROADCAST,RUNNING,MULTICAST> mtu 1500
inet6 fe80::dc58:85ff:fef0:eef1 prefixlen 64 scopeid 0x20<link>
ether de:58:85:f0:ee:f1 txqueuelen 0 (Ethernet)
RX packets 8644 bytes 680480 (664.5 KiB)
RX errors 0 dropped 0 overruns 0 frame 0
TX packets 7417 bytes 1041527 (1017.1 KiB)
TX errors 0 dropped 0 overruns 0 carrier 0 collisions 0ifconfig vethcd0643c downTest route again:
ip route get 192.168.30.11
192.168.30.11 dev br-985a84259068 src 192.168.16.1 uid 0
    cache
Also down with the bridge:
ifconfig br-985a84259068 down192.168.30.11 via 192.168.40.1 dev eth0 src 192.168.40.17 uid 0
cacheYay!
That is it for the moment. If I restart the LXC container, the bridge is
added again with the same name. Who does this? I do not know yet. -
-
What a nightmare.. that is finally solved. Ended up in the a complete different hole. It wasn't the rabbit, it was the docker.
TL;DR
On
40.17LXC, I had docker running with sevral configs.
Docker apparently decides for a default subnet based on a list of ips from:
172.17.0.0/16", 172.18.0.0/16", "172.19.0.0/16",
"172.20.0.0/14", "172.24.0.0/14" "172.28.0.0/14", "192.168.0.0/16"It verifies whether that IP range is in use. In my case, it somehow missed that
192.168.0.0/16is near my VLAN config.Adding
{
    "bip": "193.168.1.5/24",
	"default-address-pools":
	[
		{"base":"172.17.0.0/16","size":24}
	]
}
to
/etc/docker/daemon.jsonsolved the problem. But I had to identify first which container used the default network, stop it, reload docker, and start it, to refresh the network.docker network list> NETWORK ID NAME DRIVER SCOPE > 4d17f9cc818b bridge bridge local > 985a84259068 docker_default bridge local<-- this > 2d547cdc7389 funkwhale_default bridge local > abddd765db3e host host local > 5acdb2ca8271 iris_default bridge local > be879c14dc73 none null localdocker network inspect 985a84259068> "Containers": { > "24f38ca4c3e1080f050b868f4b980f3616b8047be45809276e74e217bf2f7f57": { > "Name": "Solaranzeige", <--- this > "EndpointID": "8274319e9ec797c19bcd46d2aadf9277d249135a3fbf326abc14b4893f994081", > "MacAddress": "02:42:c0:a8:10:02", > "IPv4Address": "192.168.16.2/20", <--- this > "IPv6Address": "" > } > },docker stop Solaranzeige systemctl daemon-reload systemctl restart dockerVerify:
ip addr | grep 192
    inet 192.168.40.17/24 brd 192.168.40.255 scope global eth0
Only the native VLAN!
-
Thanks so much to everybody involved here. I was entirely wrong in my initial suspicion, but the analysis helped me better understand how networks work, so I do not consider this as lost time.
Some revelations:
- for incoming traffic, wireshark, tcpdump and packet capture (pfsense) are king
- for outgoing traffic,
ip route get [host ip]helps to see in which direction traffic leaves (or doesn't leave) the host