Bug report/ntopng
-
I don't have logs, so I'm gonna try to detail as much as possible. :)
About last week or so, upgrading to 2.4.4 I was also trying out configs on HAProxy, a lot of them, it hasn't let me proxy another proxy, by Microsoft, it did before but I'm not sure what happened--anyway--I noticed the overall performance but much much more the WebGUI performance was dropping hard; a page from click to rendered would take as much as half a minute. Streaming devices caught a little stutter too, that got me off my butt and into the freezing server room.
I opened the console and went straight to top and kept pushing it on the WebGUI, thought it really wasn't necessary, it lagged plenty on its own. On top though, there was no indication of high CPU or memory, the VM was on vSAN and it's well balanced, so couldn't be disk either. Still, desperate I gave the VM more cores and dusted off my Ubiquiti gear, literally. When I was making the transition, 1 subnet/uplink-at-a-time I needed to migrate the VM, but it had NICs allocated on it so couldn't move it nor clone it bc of disk type, it seemed I made all the wrong choices when setting it up. Had to create a new one, well--not really, I have one ready to clone--cloned that and restored the backup and it was as fast as ever and since I couldn't replace the damaged one with the fresh clone because of the customizations, I wiped the instance manually and redeployed and again was back to business.
I did reset to factory defaults before reinstalling the image but some weird text appeared repeated for many lines on console on reboot so I figured it wouldn't work out and reinstalled.
I kept trying to fix HAProxy but it wore me out eventually and dozed off making me lose track of time, I'm not sure if after that or before I removed all the packages, rules and whatnot from the clone I didn't get to use and was planning to making it a proxy. Last night I spent all night rearranging a farm and killing wasted resources when I got an alert from vSphere that a hypervisor had high CPU usage: I had forgotten to take off the extra cores from pfSense, it was the little red symbol with the white nuh-uh

 line, at most I get the yellow little triangle when I'm being careless stacking tons of VMs where they obviously don't fit. It had 800% usage that single VM, that's about a third of the hypervisor's total and adding the neighbors to that it got angry.
I was going to dismiss it believing the previous issue was back but it didn't have high CPU the last time and there was network latency and now it wasn't. Logged in to the WebGUI in it was still zippy, no lags, but it was true it had high CPU from ntopng, on System Events; several ntopng instances. Before killing it off I went into it and checked for any setting that could've been causing it but there wasn't, it was pretty laxed.
I didn't have to restart pfSense for it to recover, just disabled ntopng and hours later I uninstalled. ntopng had never been buggy before. Right now it's doing the slow page loading again, although, less noticeable so I'm about to reinstall again; now since the clone of itself is in another VM, I'm going to divert traffic from it before handing it to its sources/destinations hoping my theory of it snowballing applied setting changes as garbage is right -- I know nothing about code.
—
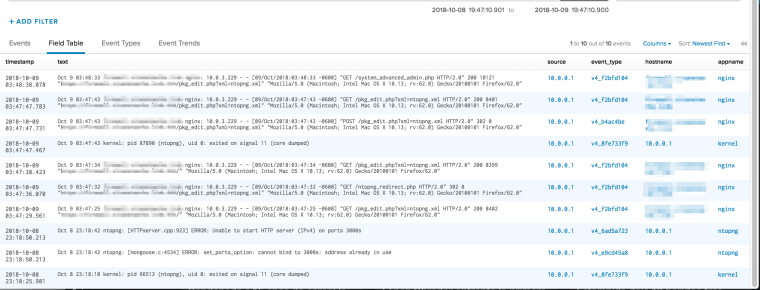
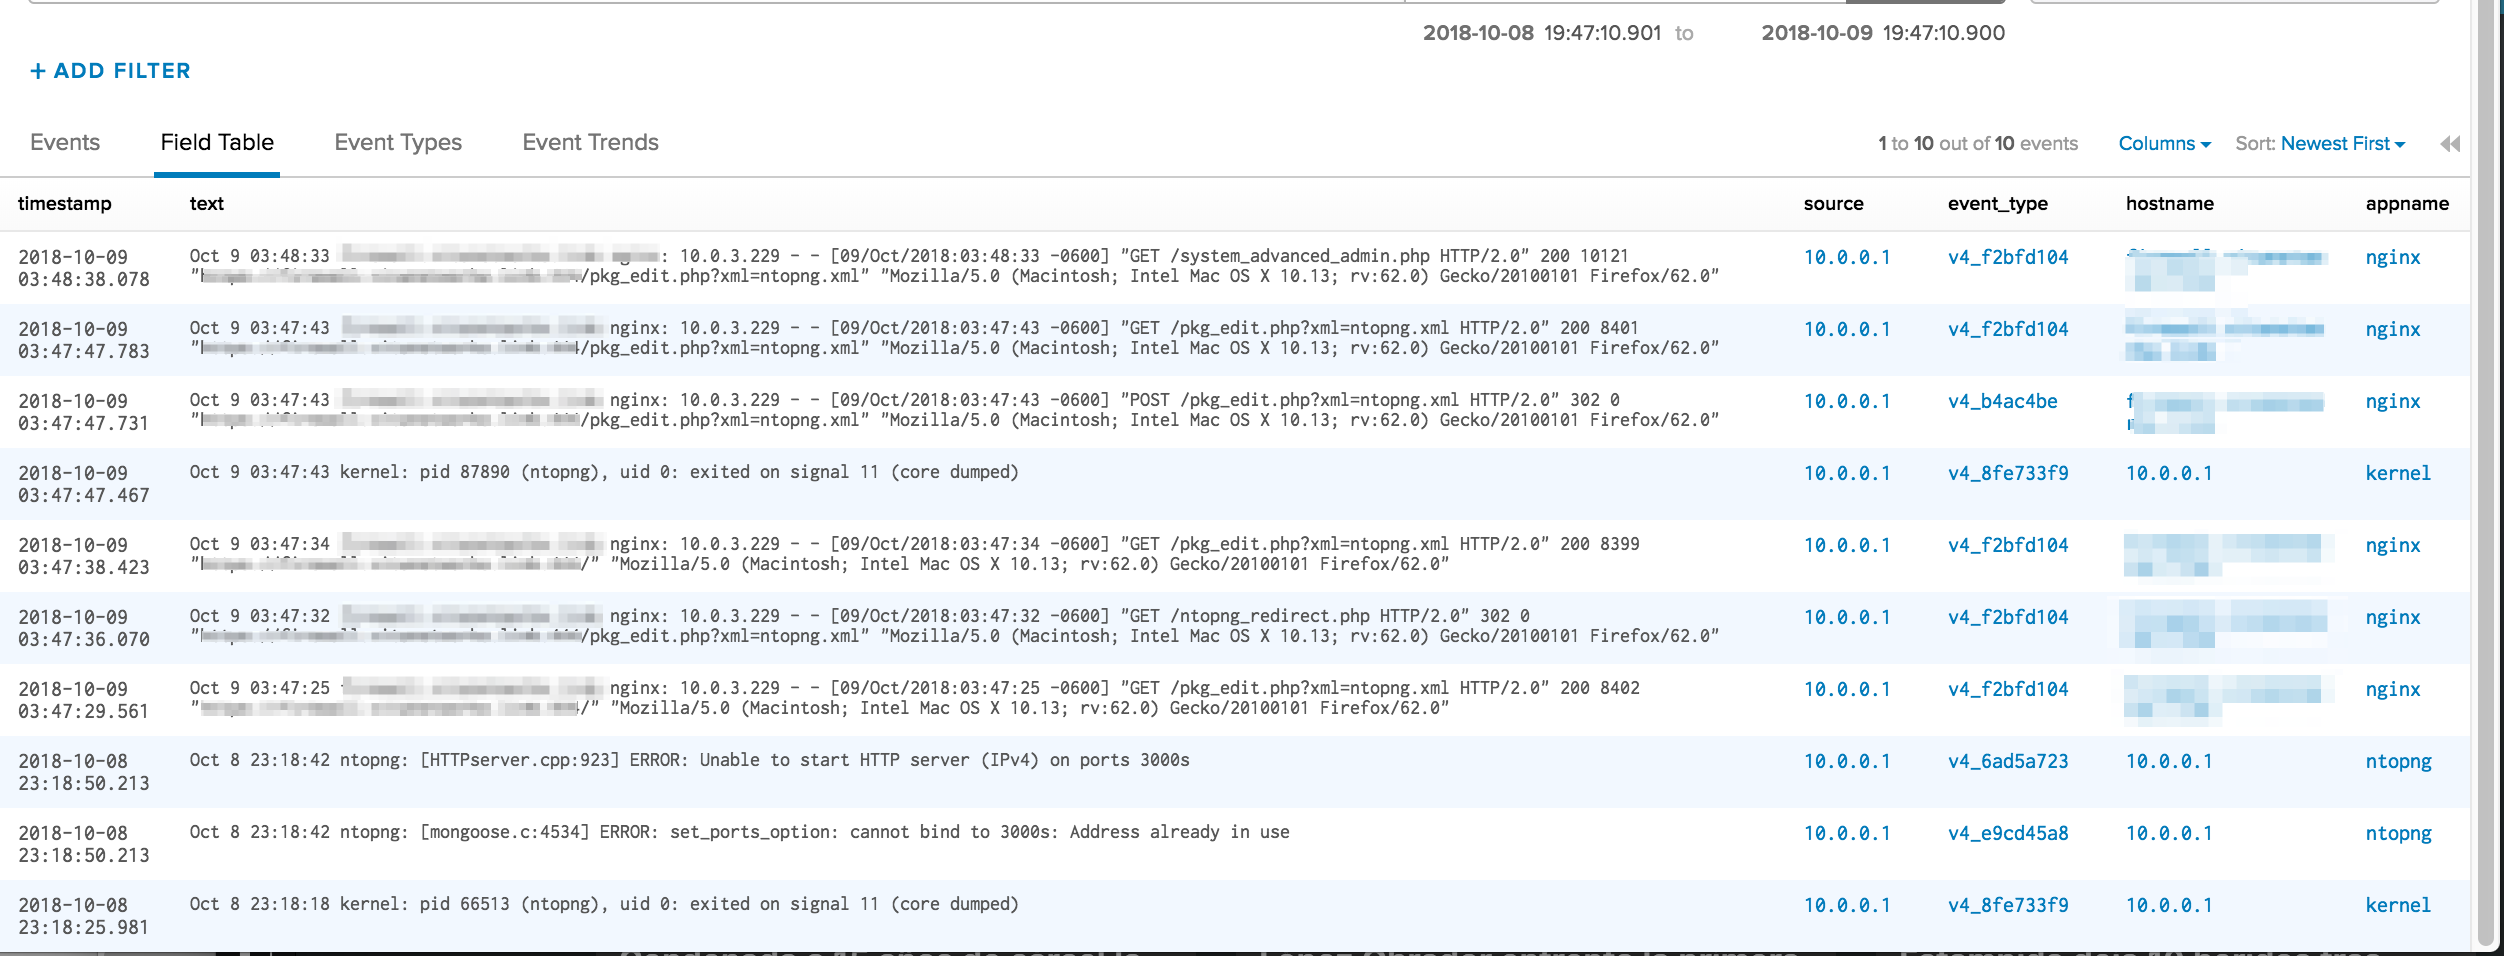
Before posting I checked on the logging server and there was something, but too little, it only let me export it as JSON which I have a feeling you'd be okay with, but after skimming the contents of the file it I think it was scoped and not the full of it so I took a screenshot. Sorry about the mess.Cheers.