Netgate Discussion Forum
    • Categories
    • Recent
    • Tags
    • Popular
    • Users
    • Search
    • Register
    • Login

    Traffic graph issue

    Scheduled Pinned Locked Moved webGUI
    6 Posts 2 Posters 994 Views
    Loading More Posts
    • Oldest to Newest
    • Newest to Oldest
    • Most Votes
    Reply
    • Reply as topic
    Log in to reply
    This topic has been deleted. Only users with topic management privileges can see it.
    • F
      Fishrman
      last edited by

      Hi all :)

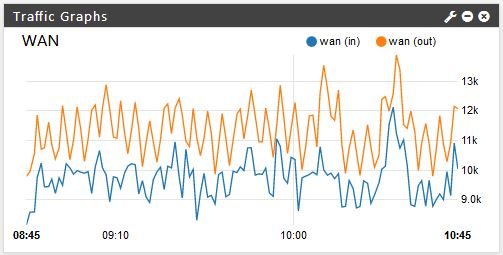
      Since a few versions (I cant even remember when did that start..) I have issues with traffic graphs. For a few minutes the graph is not showing at all. The scale down of the graph shows some weird times. Then (like after 2 minutes) the entire graph pops up.... Could anyone tell me how to fix it ?

      0_1542366786909_001.JPG

      0_1542366795669_002.JPG

      0_1542366801523_003.JPG

      N 1 Reply Last reply Reply Quote 0
      • N
        NELSONJHONE @Fishrman
        last edited by

        @fishrman you can configure refresh time, on icon "wrench"

        F 1 Reply Last reply Reply Quote 0
        • F
          Fishrman @NELSONJHONE
          last edited by

          @nelsonjhone

          But the refresh time is not the issue.
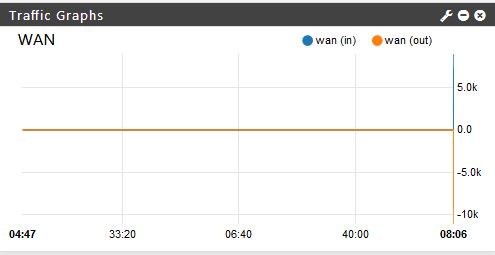
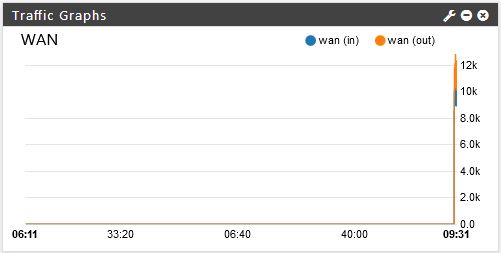
          For the first two minutes the graph is not showing at all. There is just something very squeezed showing at the right side....
          And what is the scale under the graph? 4:47 => 33:20 => 6:40 => 40:00 => 9:31 ?

          1 Reply Last reply Reply Quote 0
          • N
            NELSONJHONE
            last edited by

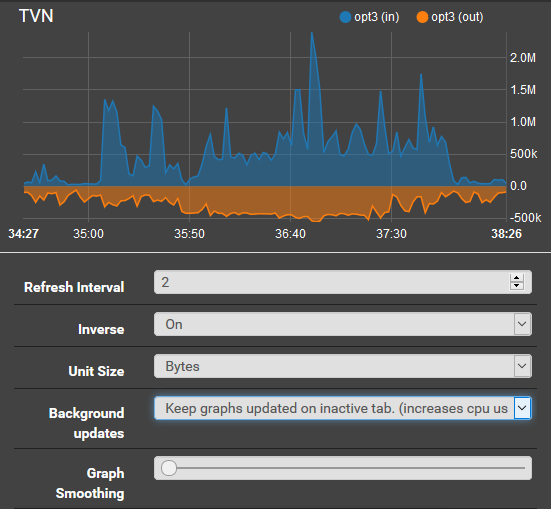
            exacty, this refresh time are a very strange. this is my configuration. I use firefox lastest version
            0_1542369911534_grafh.png

            F 1 Reply Last reply Reply Quote 0
            • F
              Fishrman @NELSONJHONE
              last edited by Fishrman

              @nelsonjhone
              I had the same apart from refresh interval = 2. I had =1. Switched to 2 and the issue is still here :(

              In your case the scale under the graph makes sense - it is logical, chronological etc.
              And what does this suppose to mean (Assuming it was 14:25)

              0_1542374678676_004.jpg

              1 Reply Last reply Reply Quote 0
              • F
                Fishrman
                last edited by

                @nelsonjhone thank you for trying to help me.

                I found out what was going on. I figured out that this may be caused by wrong time on my server. For a few versions of PFsense it was showing wrong time. It was always one hour behind, although a correct timezone was selected. I checked BIOS time, I replaced the CMOS battery... I started digging on the Internet and found a guy with similar problem. His solution was setting services -> NTP to both interfaces LAN and WAN. This finally fixed my time and.... traffic graphs.

                THNX for helping

                1 Reply Last reply Reply Quote 1
                • First post
                  Last post
                Copyright 2025 Rubicon Communications LLC (Netgate). All rights reserved.