Suricata Log Interpretation
-
I'm not sure if this is a question I can ask in here or if I'll need to go to the solution developer...
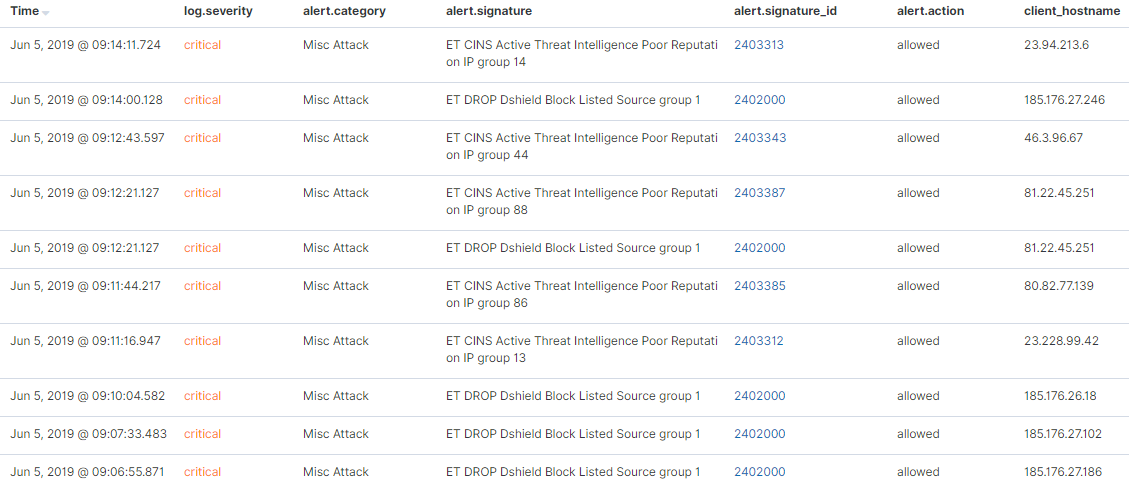
I recently setup synesis_lite_suricata for ElasticStack to ingest and parse the Suricata logs...lots of pretty colors, charts, and graphs. One of the sections shows messages that look like the image below. Am I interpreting the results correct that these communications were picked up by IDS, but allowed to pass through?

-
Which blocking mode, if any, do you have enabled on Suricata? If Block Offenders is checked on the INTERFACE SETTINGS tab, what value is selected in the IPS Mode drop-down?
What gets written to the alert log is determined by the blocking mode. Only Inline IPS Mode will result in the word "drop" being written to the log. So your external log analysis engine is probably getting fooled if you are using Legacy Mode blocking. That's because the blocking is done by the
pffirewall engine and not really by Suricata. Read the Sticky Posts at the top of this forum that describe how the various blocking modes work.The short answer is you can't 100% trust what that ElasticStack report is saying under the alert.action column.
-
Originally, I had it in legacy mode because I was lazy and didn't want to perform the additional work of using Inline mode. I understood there may be leakage by how that mode worked. After originally posting this, I went ahead and configured inline mode and am still seeing similar entries. Is there something I can look for in the eve.log to verify the information being displayed is accurate?


-
With Inline IPS mode everything is basically "Suricata native" in terms of dropped packet logging. There should be a field in the EVE data for dropped packets. I don't recall where, though. You can look through the documentation for Suricata here: https://suricata.readthedocs.io/en/suricata-4.1.4/output/eve/eve-json-output.html#eve-json-output.
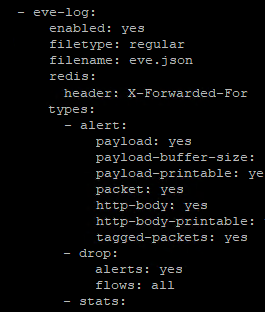
The "-drop" option should show up as enabled in your
suricata.yamlfile for the interface. You can find the exact file for the interface in a sub-directory under /usr/local/etc/suricata/suricata_xxxxx/suricata.yaml where the xxxxx is a UUID string and physical interface name.The GUI part of Suricata reads the action from the alert log under /var/log/suricata/suricata_xxxx**, where the xxxx follows the same general form as described earlier.
If you want, post the EVE output configuration part of the applicable
suricata.yamlfor the interface. Remember to dive into the appropriate sub-directory as shown up above when retrieving the file contents. Thesuricata.yamlfile in /usr/local/etc/suricata is never used. It is just a template leftover from the install. The GUI code creates thesuricata.yamlfor each interface when you start an instance on the INTERFACES tab. -
Pulling from:

The word
dropappears in the following places in the config file (Stitched some screenshots together for context):


-
That section in the "- eve-log" part of the YAML file that sets the "types:" has drop logging enabled. I believe that other setting under "outputs:" is deprecated in later Suricata versions. Have you gotten triggered alerts from the rules you have changed to DROP? That would be only those rules in the emerging-scan category. I don't see any of those rules listed in that limited log output you posted from ElasticStack.
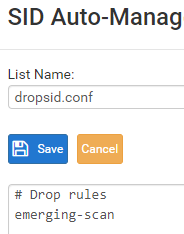
Remember that with Inline IPS Mode you will only get drops (blocks) of traffic when the triggering rule has the action DROP. The default action for all rules published by the vendors is always ALERT. You have to manually change the action of rules you want to block traffic to DROP. You can do that using SID MGMT features or you can manually toggle rule actions on the RULES tab. You can also change the action for rules shown on the ALERTS tab. I'm thinking perhaps you don't have the rules dropping that you think you do. If you want drops (blocks) from those rules shown in your ElasticStack screenshot, you will need to add those two categories to your
dropsid.conffile and then restart Suricata on the interface. -
@bmeeks In the log output screenshot in my original post, the signatures start with ET, i assumed those were emerging threats, and part of the emerging-scan set that I specify in my drop config file. Is that not the case? If not, where can I look to identify the rule set names for inclusion in my dropsid.conf?
I have not gotten any logged drops at all.
-
@Grunt0307 said in Suricata Log Interpretation:
@bmeeks In the log output screenshot in my original post, the signatures start with ET, i assumed those were emerging threats, and part of the emerging-scan set that I specify in my drop config file. Is that not the case? If not, where can I look to identify the rule set names for inclusion in my dropsid.conf?
No, far from it. That is just one of several categories of Emerging Threats rules. There are 46 categories of Emerging Threats rules. So you are changing only 1 out of 46 categories of those rules to DROP in your current
dropsid.confconfiguration. Go to the CATEGORIES tab in Suricata. See all those listings under Emerging Threats rules? Each of those is an individual file, and you would need to put that name indropsid.conf. But read the next paragraph before you do that!Go read through the Sticky Posts at the top of this sub-forum that deal with Suricata and SID MGMT and the difference between default ALERT and changing rule actions to something else such as DROP or REJECT. The last thing you want to do is change every rule to DROP. That will likely kill your Internet and frustrate you to no end!
This post is a good start: https://forum.netgate.com/topic/128480/how-automatic-sid-management-and-user-rule-overrides-work-in-snort-and-suricata
-
It sounds like you may be relatively new to administering an IDS/IPS such as Suricata or Snort. It can be overwhelming at first for sure. Managing an IPS is much more difficult that say enabling an anti-virus client. With anti-virus, you just install it, let it download virus signature definitions and you pretty much don't touch it after that. An IPS is nothing like that. Management of the rules in an IPS takes lots of hands-on work and requires a lot of knowledge about what the rules are designed to detect. Based on that info, you as the admin decide which ones you want to block traffic and which ones you would rather just alert on traffic (i.e., print a message that traffic matching the signature was detected but allowed to pass since the action was alert). Drop rules, when triggered using Inline IPS Mode, will actually block the traffic and then log an alert (but with the action noted as drop).
To make life easier getting started, let me offer you a suggestion. Go register for a Snort subscription Oinkcode. There are two levels: (1) free registered, and (2) paid. The paid subscription for an individual is $29.99/year. The difference in the two is that paid subscribers get new rules 30 days ahead of the free users. So a new rule to detect a new exploit will not show up in the free rules until it has been in the paid rules list for 30 days or longer. The Snort website knows which rules to send you (paid or free) based on your Oinkcode. The filenames for the two rules are identical. The content is different based on your Oinkcode supplied as part of the URL.
Once you get an Oinkcode, go to the GLOBAL SETTINGS tab and enable the Snort Subscriber Rules. Enter your Oinkcode in the box for that, and then for the snapshot filename type in snortrules-snapshot-29130.tar.gz. This tells Suricata which version of Snort rules to fetch. Once you input and save this information, go to the UPDATES tab and click Update to download the Snort Subscriber Rules.
Now go to the CATEGORIES tab and check the box to enable Use IPS Policy. Then in the IPS Policy drop-down choose Connectivity to start with. Make the sure the IPS Policy Mode drop-down has Policy selected. Save the changes and restart Suricata on the interface. These choices only show up on the CATEGORIES tab when you have Snort Subscriber Rules enabled. This is because only those rules contain special ips-policy metadata that automatically causes some rules to switch from ALERT to DROP.
The "Connectivity" policy is a good starter policy. Don't expect to see any alerts or drops from it with normal traffic. Only if you get hit with bad stuff will those rules fire. The next most secure policy is Balanced. It may generate a false positive now and then depending on what traffic goes across you network. Security is a very stringent policy and will generate false positives in most environments. I suggest starting with Connectivity.
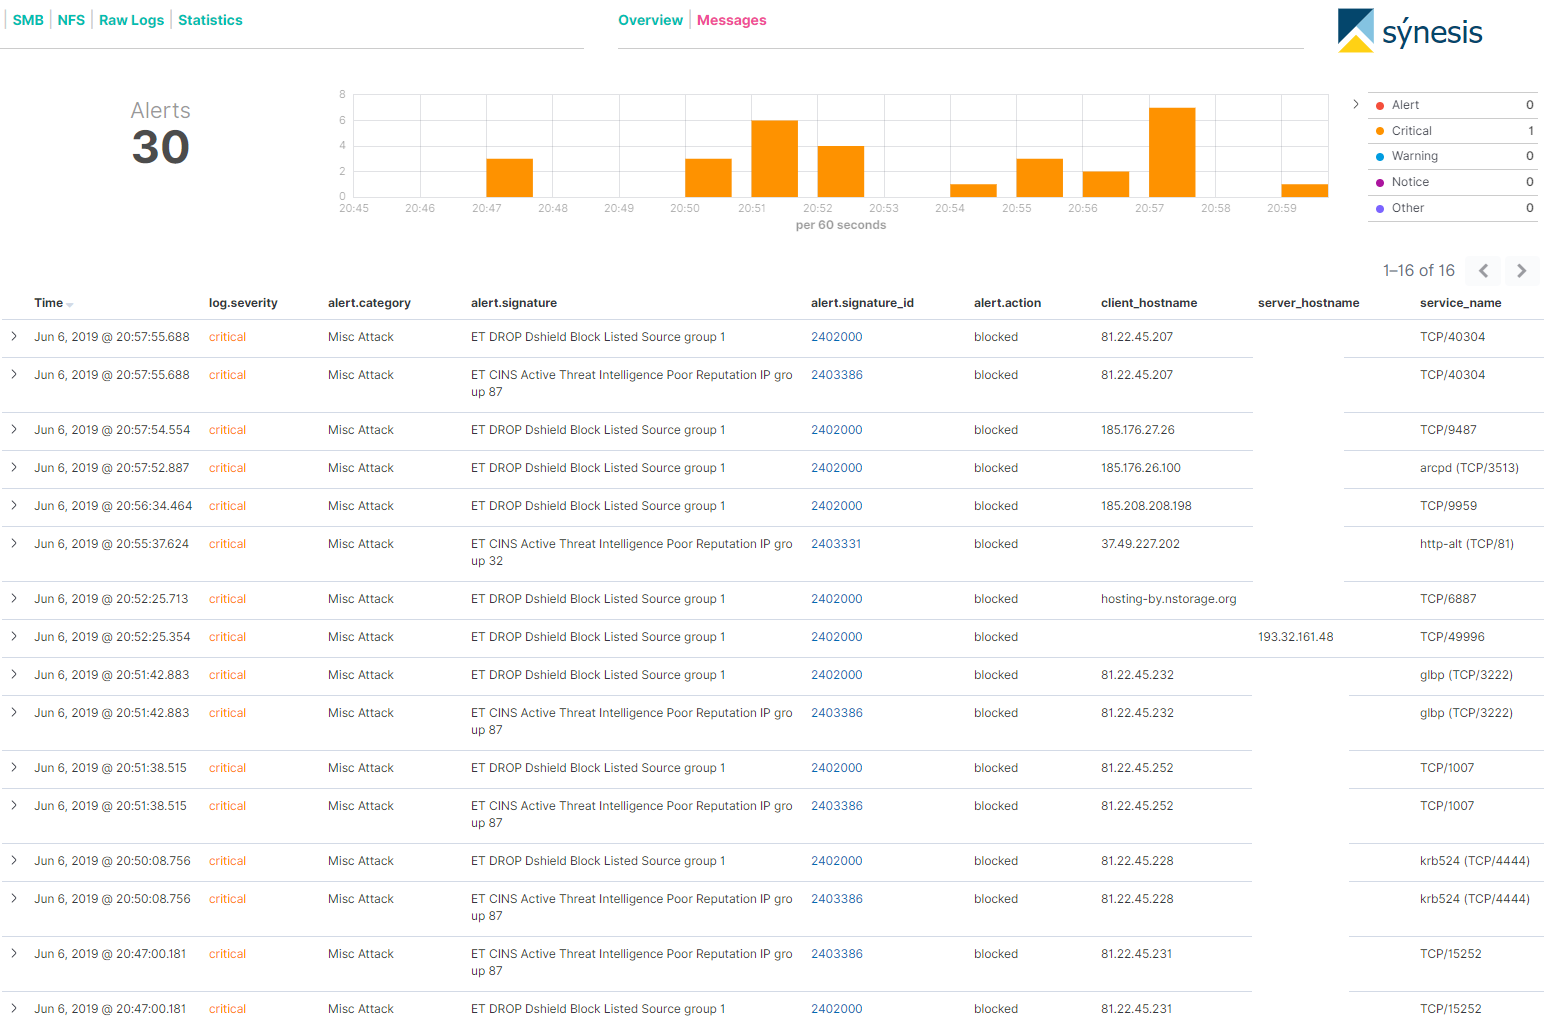
If you just want to see some drops so you can catch some events in your ElasticStack reports, then you can set the following Emerging Threats categories to DROP on the SID MGMT tab by putting these two names in your
dropsid.confalong with the emerging-scan name you already have there like this:#dropsid emerging-scan emerging-ciarmy emerging-dshieldSave the changes and restart Suricata. Then you should start seeing some drop messages in the ElasticStack logs.
-
Thanks for the info, I'm seeing blocks now, although I may have to adjust it. I have this on a SG-5100 and its struggling to max out a download test of 400Mbps.
#dropsid
emerging-attack_response
emerging-botcc
emerging-compromised
emerging-ciarmy
emerging-drop
emerging-dshield
emerging-exploit
emerging-malware
emerging-scan
emerging-tor
emerging-trojan
emerging-web_server
-
To help with speed, make sure you check that the NIC tuneables are following the guidelines in this Sticky Post: https://forum.netgate.com/topic/138613/configuring-pfsense-netmap-for-suricata-inline-ips-mode-on-em-igb-interfaces.
Let me offer you another suggestion. Running Suricata or any IDS/IPS on the WAN is generally not the best idea. First of all, the default configuration for pfSense is for the firewall to drop (block) all unsolicited inbound traffic anyway. So why bog down the CPU with Suricata doing inspections of packets the firewall is going to drop anyway? I'm talking about things like all those IP addresses in the emerging-dshield and emerging-ciarmy rules. If you just want to see some blocks to be sure logging is working, then fine; but I would not waste CPU resources with Suricata scanning and blocking stuff the firewall is already going to drop.
Instead, put Suricata on your LAN and run one of those Snort IPS Policies I mentioned. That will protect you from the actual bad stuff that may be coming and going on the LAN side. As a bonus, the IP addresses in all the alerts will be your internal LAN host IPs. When you run Suricata on the WAN, all the local IP addresses will show with your WAN public IP when you are using NAT. This is because Suricata will see inbound WAN traffic before the NAT is undone.
An IDS/IPS is very CPU-intensive (much more so than a simple firewall) because it is inspecting the contents of packets and the IP addresses. It is doing complex pattern matching looking for matches with rule signatures. A firewall, on the other hand, simply has to grab the source and destination IP addresses, compare those to its list of rules and make a decision. That's much faster and uses less CPU. The more rules you put in the IPS, the slower things get. So be sure you run only the rules that really protect your network assests. If you don't run a mail server, then don't load mail server rules, if you don't have a DNS server exposed to the Internet (most folks do not), then don't run DNS server rules. If you don't have a public-facing web server accessible on the WAN, then don't run web server rules, etc. Conserve your CPU resources for the rules that you really want such as malware signatures, botnet C&C servers, etc.
-
Makes sense, let me ask you this then. I intend to have a DMZ network setup on another interface. If I configured Suricata to inspect my LAN and DMZ interfaces, that will increase the load on the system, correct? I'm assuming it would launch an instance of Suricata for each monitored interface resulting in duplicate data being loaded for each interface.
-
@Grunt0307 said in Suricata Log Interpretation:
Makes sense, let me ask you this then. I intend to have a DMZ network setup on another interface. If I configured Suricata to inspect my LAN and DMZ interfaces, that will increase the load on the system, correct? I'm assuming it would launch an instance of Suricata for each monitored interface resulting in duplicate data being loaded for each interface.
That is correct. Each monitored Suricata interface will be a separate instance, and so resource utilization will increase when monitoring multiple interfaces. You can manage this by limiting the rules applied to each interface to only those needed to protect the assets behind that interface. Refer to my earlier example about mail servers, public-facing DNS servers and so forth. But in the end there is no free lunch. Using a tool like an IPS with rules takes CPU resources. Fortune 500 corporations do this by throwing a lot of really big iron at the problem (servers with lots of RAM and multiple Xeon server CPUs).
My first reply about not putting the IPS on the WAN was based on the assumption you had only a WAN and LAN. That's the most common configuration for pfSense users. Some may have a number of VLANs running on say the LAN interface. In that case you can have Suricata run in promiscuous mode to see all the traffic on the interface to help with resource conservation. Promiscuous mode doesn't help with separate physical interfaces, though.
I would think that with configuring the NIC's
sysctrlsettings like those I linked to several replies back, and choosing wisely which rules to enable, that you can achieve very close to linespeed on the SG-5100. Making sure flow control is disabled on the NIC is said to make a big difference.