export pfBlocker logs incl feed name via syslog.
-
Is it possible to export the LOGS with the FEED name
Currently I export the pfSens firewall log to ELK stack it would be nice to see what feed is triggered the blockThanks in advance
-
https://www.reddit.com/r/pfBlockerNG/comments/bu0ms0/pfblockerngtelegrafinfluxdb_ip_block_list/
-
Hi BBcan177
Thanks for the link, I managed to setup telegraph and export the logs to elasticsearch, one firewall however is beaking the GROK pattern there is a double ,, (coma) in the log file. here is a sample, Look towards the end just before the ASN field. I would expect there must be the interface name vtnet0
Jun 14 22:07:40,1770010075,vtnet0,WAN,block,4,6,TCP-S,211.54.163.21,10.67.11.107,18959,52869,in,KR,pfB_PRI1_v4,211.54.163.21,CINS_army_v4,Unknown,,| 4766 | KIXS-AS-KR | Korea Telecom |,+
Jun 14 22:07:40,1770010289,vtnet0,WAN,block,4,6,TCP-S,190.151.94.2,10.67.11.138,45327,25,in,CL,pfB_PRI3_v4,190.151.94.2,BlockListDE_All_v4,Unknown,,| 6471 | ENTEL CHILE S.A. | ENTEL CHILE S.A. |,+
Jun 14 22:07:40,1770010075,vtnet0,WAN,block,4,6,TCP-S,185.176.27.2,10.67.11.207,47411,53389,in,RU,pfB_PRI1_v4,185.176.26.0/23,ET_Block_v4,Unknown,,| 204428 | SS-Net | SS-Net |,+
Jun 14 22:07:42,1770010075,vtnet0,WAN,block,4,6,TCP-S,111.252.72.147,10.67.11.105,27223,37215,in,TW,pfB_PRI1_v4,111.252.72.147,CINS_army_v4,111-252-72-147.dynamic-ip.hinet.net,,| 3462 | HINET | Data Communication Business Group |,+
Jun 14 22:07:42,1770010075,vtnet0,WAN,block,4,6,TCP-S,71.6.233.211,10.67.11.141,2083,2083,in,US,pfB_PRI1_v4,71.6.233.0/24,CINS_army_v4,scanners.labs.rapid7.com,,| 10439 | CARINET | CariNet Inc. |,+
Jun 14 22:07:43,1770010099,vtnet0,WAN,block,4,6,TCP-S,199.101.124.79,10.67.11.115,16631,37215,in,US,pfB_PRI2_v4,199.101.124.79,Alienvault_v4,199-101-124-79-dynamic.northstate.net,,| 22709 | NSTELCO | North State Telephone Co. |,+Thanks
-
@jacol said in export pfBlocker logs incl feed name via syslog.:
Thanks for the link, I managed to setup telegraph and export the logs to elasticsearch, one firewall however is beaking the GROK pattern there is a double ,, (coma) in the log file. here is a sample, Look towards the end just before the ASN field. I would expect there must be the interface name vtnet0
Jun 14 22:07:40,1770010075,vtnet0,WAN,block,4,6,TCP-S,211.54.163.21,10.67.11.107,18959,52869,in,KR,pfB_PRI1_v4,211.54.163.21,CINS_army_v4,Unknown,,| 4766 | KIXS-AS-KR | Korea Telecom |,+
That missing log entry is the "Hostname". If its not found, it should log "Unknown".
Can you run this test and report back what on the output of the command? It should contain the Hostname for that Local IP:
Goto pfSense > Diagnostics > Command Prompt > Execute PHP Commands, and paste the following two lines in the box and hit "Execute":
include_once('/usr/local/pkg/pfblockerng/pfblockerng.inc');
print_r(pfb_collect_localhosts());
I assume that IP is not listed, so we need to see why it doesn't have a Hostname.
Alternatively, the GROK pattern could probably see that its an empty field. I haven't had time to play with it, so can't offer much assistance there...
-
Hi BBcan177
Output below:
Array
(
[126.38.200.66] => <------- this is the WAN interface
[10.67.11.1] => lan
[10.67.14.1] => opt1
[192.168.4.1] => opt2
[10.2.2.1] => opt3
[149.232.195.165] => opt4
[113.150.207.208] => beach
[10.67.11.18] => ts
[10.67.11.133] => twitter
[10.67.11.115] => unifi
[10.67.11.106] => unimed
[10.67.11.28] => vet <------- this host defined under DNS resolver with Description
[46.161.73.84] => <------- this host defined under DNS resolver with OUT Description
[10.67.11.128] =>
[10.67.11.105] =>
[10.67.11.118] =>
[10.67.11.134] =>
[10.67.11.137:25] =>
}I had a host name defined under DNS resolver, But no REMARK, after I added a remark it seems to work correct.
many thanks !
-
@jacol Could you share your config in elasticsearch side that enabled you to get the logs?
-
Hi @JohanÅ
I will try to explain what I did, I am not a Elasticsearch or GROK expert hope this helps.
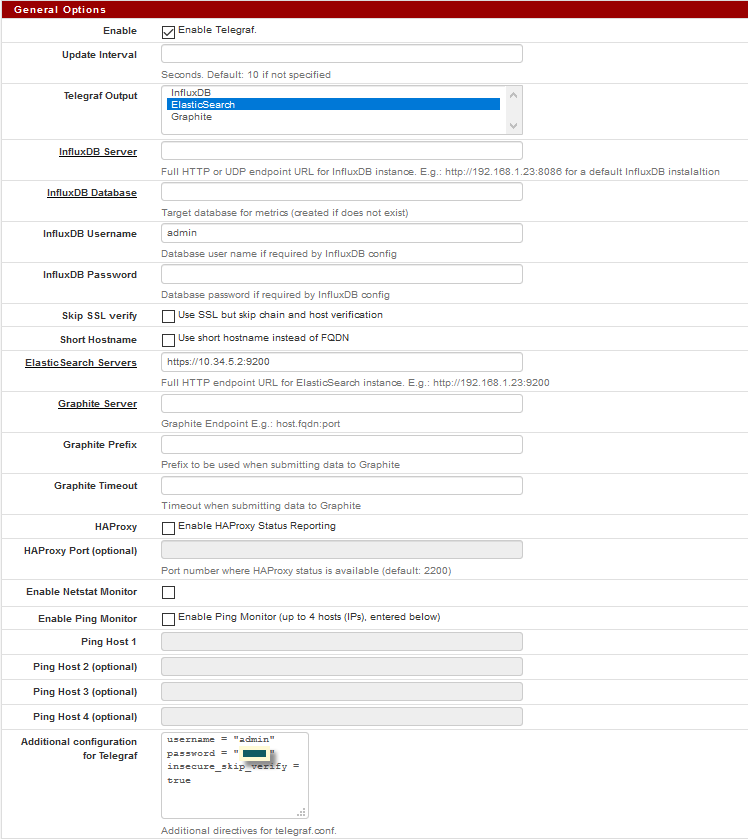
- Edit the Telegraf file /usr/local/pkg/pfblockerng/pfblockerng.inc
this sample telegraf.tar below sends
/var/log/pfblockerng/ip_block.log
/var/log/pfblockerng/dnsbl.log
/var/squid/logs/access.log ( not used in this config )<?php /* * telegraf.inc * * part of pfSense (https://www.pfsense.org) * Copyright (c) 2017 Rubicon Communications, LLC (Netgate) * All rights reserved. * * Licensed under the Apache License, Version 2.0 (the "License"); * you may not use this file except in compliance with the License. * You may obtain a copy of the License at * * http://www.apache.org/licenses/LICENSE-2.0 * * Unless required by applicable law or agreed to in writing, software * distributed under the License is distributed on an "AS IS" BASIS, * WITHOUT WARRANTIES OR CONDITIONS OF ANY KIND, either express or implied. * See the License for the specific language governing permissions and * limitations under the License. */ require_once("functions.inc"); require_once("globals.inc"); require_once("pkg-utils.inc"); require_once("service-utils.inc"); require_once("util.inc"); function telegraf_resync_config() { global $g, $config; $telegraf_conf = array(); if (is_array($config['installedpackages']['telegraf'])) { foreach ($config['installedpackages']['telegraf']['config'][0] as $k => $v) { $telegraf_conf[$k] = addslashes($v); } } conf_mount_rw(); /* disable telegraf if not enabled */ if ($telegraf_conf['enable'] != "on") { if (is_service_running("telegraf")) { stop_service("telegraf"); } unlink_if_exists("/usr/local/etc/rc.d/telegraf.sh"); unlink_if_exists("/usr/local/etc/telegraf.conf"); return; } if (empty($telegraf_conf['interval'])) { $telegraf_conf['interval'] = 10; } $shortname = ''; if ($telegraf_conf['shortname'] == 'on') { $shortname = "\thostname = \"" . $config['system']['hostname'] . "\""; } $ca_pem_file = "/usr/local/etc/telegraf.ca"; $a_ca = $config['ca']; if (!is_array($a_ca)) { $a_ca=array(); } if (count($a_ca)) { $ca_pem = ''; foreach ($a_ca as $ca) { $ca_pem .= base64_decode($ca['crt']); } file_put_contents($ca_pem_file, $ca_pem); } /* generate telegraf.conf */ $cfg = <<< EOD # This file is automatically generated by pfSense # [agent] interval = "{$telegraf_conf['interval']}s" round_interval = true {$shortname} [[inputs.logparser]] files = ["/var/log/pfblockerng/ip_block.log"] from_beginning=true [inputs.logparser.grok] measurement = "ip_block_log" patterns = ["^%{SYSLOGTIMESTAMP:timestamp:ts-syslog},%{NUMBER:TrackerID},%{WORD:Interface},%{WORD:InterfaceName:tag},%{WORD:action},%{NUMBER:IPVersion},%{NUMBER:ProtocolID},%{GREEDYDATA:Protocol:tag},%{IPORHOST:SrcIP:tag},%{IPORHOST:DstIP:tag},%{NUMBER:SrcPort:tag},%{NUMBER:DstPort:tag},%{WORD:Dir:tag},%{WORD:GeoIP:tag},%{GREEDYDATA:AliasName},%{GREEDYDATA:IPEvaluated:tag},%{GREEDYDATA:FeedName:tag},%{HOSTNAME:ResolvedHostname},%{HOSTNAME:ClientHostname:tag},%{GREEDYDATA:ASN},%{GREEDYDATA:DuplicateEventStatus}","^%{SYSLOGTIMESTAMP:timestamp:ts-syslog},%{NUMBER:TrackerID},%{WORD:Interface},%{WORD:InterfaceName:tag},%{WORD:action},%{NUMBER:IPVersion},%{NUMBER:ProtocolID},%{WORD:Protocol:tag},%{IPORHOST:SrcIP:tag},%{IPORHOST:DstIP:tag},%{WORD:icmp_action},%{INT:icmp_packets},%{WORD:Dir:tag},%{WORD:GeoIP:tag},%{GREEDYDATA:AliasName},%{GREEDYDATA:IPEvaluated:tag},%{GREEDYDATA:FeedName:tag},%{HOSTNAME:ResolvedHostname},%{HOSTNAME:ClientHostname:tag},%{GREEDYDATA:ASN},%{GREEDYDATA:DuplicateEventStatus}"] timezone = "Local" [[inputs.logparser]] files = ["/var/log/pfblockerng/dnsbl.log"] from_beginning=true [inputs.logparser.grok] measurement = "dnsbl_log" patterns = ["^%{WORD:BlockType}-%{WORD:BlockSubType},%{SYSLOGTIMESTAMP:timestamp:ts-syslog},%{IPORHOST:destination:tag},%{IPORHOST:source:tag},%{GREEDYDATA:call},%{WORD:BlockMethod},%{WORD:BlockList:tag},%{IPORHOST:tld:tag},%{WORD:DefinedList:tag},%{GREEDYDATA:hitormiss}"] timezone = "Local" [[inputs.logparser]] files = ["/var/squid/logs/access.log"] from_beginning=true [inputs.logparser.grok] measurement = "squid_log" patterns = ["^%{NUMBER:timestamp}%{SPACE}%{NUMBER:duration:tag} %{IP:client_address:tag} %{WORD:cache_result:tag}/%{POSINT:status_code:tag} %{NUMBER:bytes:tag} %{WORD:request_method:tag} %{NOTSPACE:url:tag} %{NOTSPACE:user:tag} %{WORD:hierarchy_code:tag}/%{NOTSPACE:server:tag} %{NOTSPACE:content_type:tag}"] timezone = "Local" EOD; /* HAProxy Monitor Configuration */ if ($telegraf_conf["haproxy_enable"]) { $ha_port = 2200; if ($telegraf_conf["haproxy_port"]) { $ha_port = $telegraf_conf["haproxy_port"]; } $cfg .= "\n[[inputs.haproxy]]\n"; $cfg .= "\tservers = [\"http://127.0.0.1:" . $ha_port . "/haproxy/haproxy_stats.php?haproxystats=1\"]\n"; $cfg .= "\n"; } /* Ping Monitor Configuration */ if ($telegraf_conf["ping_enable"]) { if (!empty($telegraf_conf['ping_host_1'])) { $monitor_hosts[] = '"' . $telegraf_conf["ping_host_1"] . '"'; } if (!empty($telegraf_conf['ping_host_2'])) { $monitor_hosts[] = '"' . $telegraf_conf["ping_host_2"] . '"'; } if (!empty($telegraf_conf['ping_host_3'])) { $monitor_hosts[] = '"' . $telegraf_conf["ping_host_3"] . '"'; } if (!empty($telegraf_conf['ping_host_4'])) { $monitor_hosts[] = '"' . $telegraf_conf["ping_host_4"] . '"'; } $monitor_hosts = implode(",", $monitor_hosts); $cfg .= "\n[[inputs.ping]]\n"; $cfg .= "\turls = [" . $monitor_hosts . "]"; $cfg .= "\n\tdeadline = 0\n\n"; /* deadline (-w) function not supported in BSD ping */ } /* Netstat Configuration */ if ($telegraf_conf["netstat_enable"]) { $cfg .= "[[inputs.netstat]]\n\n"; } if ((is_array($telegraf_conf['telegraf_output']) && in_array("influxdb", $telegraf_conf['telegraf_output'])) || $telegraf_conf['telegraf_output'] == "influxdb") { $cfg .= "[[outputs.influxdb]]\n"; $cfg .= "\turls = [\"" . $telegraf_conf['influx_server'] . "\"]\n"; $cfg .= "\tdatabase = \"" . $telegraf_conf['influx_db'] . "\"\n"; if (!empty($telegraf_conf['influx_user'])) { $cfg .= "\tusername = \"" . $telegraf_conf['influx_user'] . "\"\n"; } if (!empty($telegraf_conf['influx_pass'])) { $cfg .= "\tpassword = \"" . base64_decode($telegraf_conf['influx_pass']) . "\"\n"; } if ($telegraf_conf['insecure_skip_verify'] == "on") { $cfg .= "\tinsecure_skip_verify = true\n"; } if (count($a_ca)) { $cfg .= "\tssl_ca = \"" . $ca_pem_file . "\"\n"; } } else if ((is_array($telegraf_conf['telegraf_output']) && in_array("elasticsearch", $telegraf_conf['telegraf_output'])) || $telegraf_conf['telegraf_output'] == "elasticsearch") { $cfg .= "[[outputs.elasticsearch]]\n"; $cfg .= "\tenable_sniffer = false\n"; $cfg .= "\thealth_check_interval = \"10s\"\n"; $cfg .= "\tindex_name = \"telegraf-%Y.%m.%d\"\n"; $cfg .= "\turls = [\"" . $telegraf_conf['elasticsearch_server'] . "\"]\n"; } else if ((is_array($telegraf_conf['telegraf_output']) && in_array("graphite", $telegraf_conf['telegraf_output'])) || $telegraf_conf['telegraf_output'] == "graphite") { $cfg .= "[[outputs.graphite]]\n"; $cfg .= "\tservers = [\"" . $telegraf_conf['graphite_server'] . "\"]\n"; if (!empty($telegraf_conf['graphite_prefix'])) { $cfg .= "\tprefix = \"" . $telegraf_conf['graphite_prefix'] . "\"\n"; } else { $cfg .= "\tprefix = \"monitor\"\n"; } $cfg .= "\ttemplate = \"host.tags.measurement.field\"\n"; if (!empty($telegraf_conf['graphite_timeout'])) { $cfg .= "\ttimeout = " . $telegraf_conf['graphite_timeout'] . "\n"; } else { $cfg .= "\ttimeout = 2\n"; } } /* Raw additional configuration options */ if ($telegraf_conf["telegraf_raw_config"]) { #$telegraf_conf["telegraf_raw_config"] = $_POST["telegraf_raw_config"]; $cfg .= "\n# Additional Raw Options\n"; $cfg .= $_POST["telegraf_raw_config"]; $cfg .= "\n"; } $conffile = "/usr/local/etc/telegraf.conf"; file_put_contents($conffile, $cfg); /* generate telegraf.sh rcfile */ $pidfile = "{$g['varrun_path']}/telegraf.pid"; $logfile = "{$g['varlog_path']}/telegraf.log"; write_rcfile(array( "file" => "telegraf.sh", "start" => "/usr/sbin/daemon -crP {$pidfile} /usr/local/bin/telegraf -config={$conffile} 2> {$logfile}", "stop" => "/bin/kill `/bin/cat {$pidfile}`" ) ); /* (re)start service */ if (is_service_running("telegraf")) { restart_service("telegraf"); } else { start_service("telegraf"); } sleep(1); conf_mount_ro(); } ?>- in Pfsense install telegraf and send the logs to Elasticsearch
eg. https://10.34.5.2:9200
-
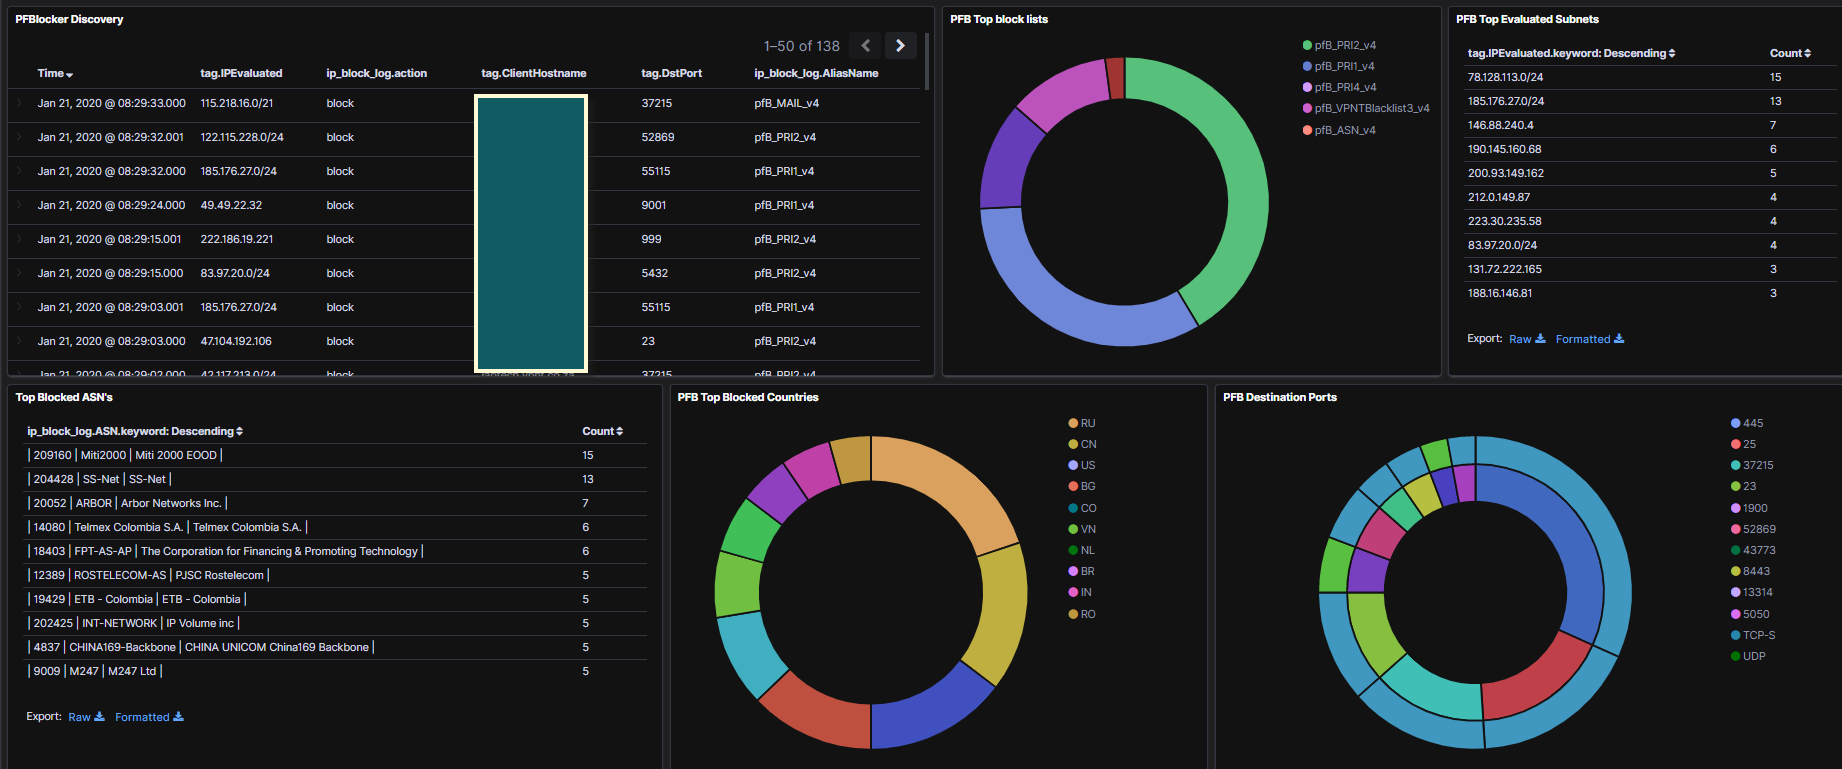
In Elasticsearch create a index for the new data
-
Here is my json file I exported
-
@jacol Awesome message, thanks!
I will try this today. Just to clarify, you add the username and password because you use xpack (at least the core is now free in normal Elasticsearch)?
Also to clarify, you just installed the Telegraf from Available packages and did not update the files from Github? And one more question, do you have grok parser in logstash for these or how does your Logstash input look like?
-
I used Docker with Open Distro for Elasticsearch
I used telegraf-1.8.3_freebsd_amd64.tar.gz
Here is the version
[2.4.4-RELEASE][root@firewall]/root: /usr/local/bin/telegraf --version
Telegraf 1.8.3 (git: HEAD f2979106)Telegraf does the log parsing and send directly to Elasticsearch no Logstash used.
-
@jacol Thanks, I got it working. Turns out that my config was right but I noticed from PFSense syslog that I get login 401 to my ELK server. Changed the user and now it works!