excessive RAM usage
-
Hello, i've been trying to diagnose an issue with my pfsense build and have finally (almost certainly) narrowed it down to pfBlockerNG.
I have done multiple installs, some into proxmox (1 VM across the whole machine), and some on bare metal. On my most recent install I didn't even bother to restore from backup, instead reconfiguring the entire system from scratch.
So what happens is I get 100% swap maxed on my 8Gb RAM machine and need to reboot. Unbound is >11Gb, which given the extent of my enabled feeds list feels really disproportionate?
The enabled feeds are:
pfB_PRI1_v4	19,501
DNSBL_EasyList	3,402
DNSBL_ADs	71,763
DNSBL_Malicious	165,171
DNSBL_hpHosts	717,337
top:
last pid: 30150; load averages: 0.66, 0.54, 0.44 up 2+18:14:27 16:34:30 67 processes: 1 running, 64 sleeping, 2 waiting CPU: 0.0% user, 0.0% nice, 6.9% system, 0.0% interrupt, 93.1% idle Mem: 6917M Active, 52K Inact, 861M Wired, 617M Buf, 37M Free Swap: 4096M Total, 4096M Used, K Free, 100% Inuse PID USERNAME THR PRI NICE SIZE RES STATE C TIME WCPU COMMAND 28544 root 1 20 0 7812K 3112K CPU2 2 0:00 0.04% top 44668 root 1 20 0 4644K 1880K select 3 0:01 0.04% clog_pfb 46479 nobody 1 20 0 10868K 5124K select 2 0:19 0.03% darkstat 54428 root 5 52 0 6900K 2016K uwait 3 0:12 0.02% dpinger 20699 root 1 20 0 12904K 5888K select 3 0:00 0.01% sshd 45573 dhcpd 1 20 0 12580K 2196K select 0 0:00 0.01% dhcpd 43012 root 1 20 0 12908K 13012K select 3 0:09 0.01% ntpd 96605 root 1 20 0 10436K 5324K kqread 1 0:00 0.00% lighttpd_pfb 339 root 1 20 0 94292K 8504K kqread 3 0:06 0.00% php-fpm 15832 root 1 20 0 6600K 1856K bpf 3 0:11 0.00% filterlog 34948 unbound 4 22 0 11300M 0K pfault 2 0:25 0.00% <unbound> 1287 root 1 22 0 8841M 0K pfault 2 0:20 0.00% <unbound-checkconf> 340 root 1 52 0 98844K 14372K piperd 3 0:08 0.00% php-fpm 18959 root 1 52 20 6968K 0K wait 2 0:07 0.00% <sh> 6254 root 1 20 0 6400K 2008K select 0 0:05 0.00% syslogd 341 root 1 52 0 94488K 0K accept 2 0:02 0.00% <php-fpm> 37594 root 1 52 0 94488K 0K accept 2 0:01 0.00% <php-fpm> 97162 root 1 23 0 51308K 1164K piperd 3 0:01 0.00% php 29657 root 1 41 20 25424K 0K pfault 1 0:00 0.00% <unbound-control> 42631 root 1 20 0 6368K 0K WAIT 0 0:00 0.00% <cron> 96743 root 1 20 0 51308K 6244K piperd 1 0:00 0.00% php 42079 root 1 20 0 23592K 0K kqread 2 0:00 0.00% <nginx> 65015 root 2 34 0 6528K 1912K piperd 3 0:00 0.00% sshg-blocker 44931 root 1 20 0 51372K 5156K piperd 1 0:00 0.00% php_pfb 96827 root 1 52 0 51308K 4844K piperd 3 0:00 0.00% php 417 root 1 20 0 9184K 312K select 3 0:00 0.00% devd -
Hi,
You you have the "TLD" option checked ?
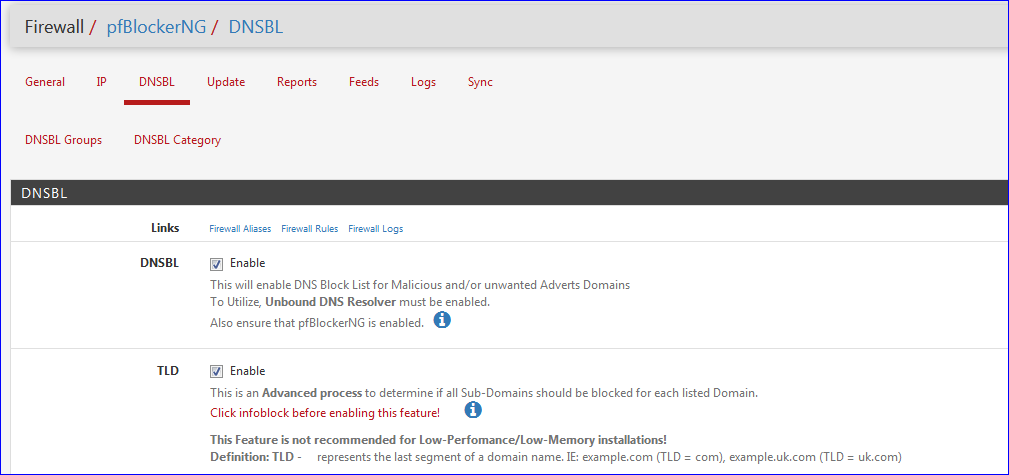
If so, click on the blue "I" - right after the red text.
So : uncheck TLD, or go out and buy really huge RAM sticks.
Or remove some feeds.