TLD shutting down on pfBlockerNG-dev?
-
I am running pfSense 2.4.4 (p3) with pfBlockerNG-devel 2.2.5_29 on an 8- core Atom box with 8 GB of memory. The only other active package is Snort.
- With TLD disabled and pfBlockerNG enabled with some common lists and GeoIP, I run on 15-20% memory saturation
- With TLD enabled immediately after install or force-reload, I run on 80-85% memory saturation
- When I revisit dashboard a few hours or a day later, memory saturation is back down to 15-20%, while TLD is still enabled in the GUI
- I have set cron update frequency to ‚daily‘, so no updates/reloads have occurred inbetween
- After yet another force-reload, mem sat is again 80-85%; reload log looks OK
(EDIT: The timescale of memory usage decreasing gradually after a force reload from 85% down to 25% is about two hours (I repeatedly checked the dashboard). I had expected that pfBlockerNG with TLD would occupy the memory persistently. Please bear with me, if I am missing something obvious!)
I had the same effect on pfBlockerNG (non-devel) with TLD enabled.
Is this a known issue? Is there a way to check what is going on? Is TLD shutting down along the way?
Although off topic: kudos and many thanks @BBcan177 for pfBlockerNG which is such a great extension of pfSense‘s capabilities!
-
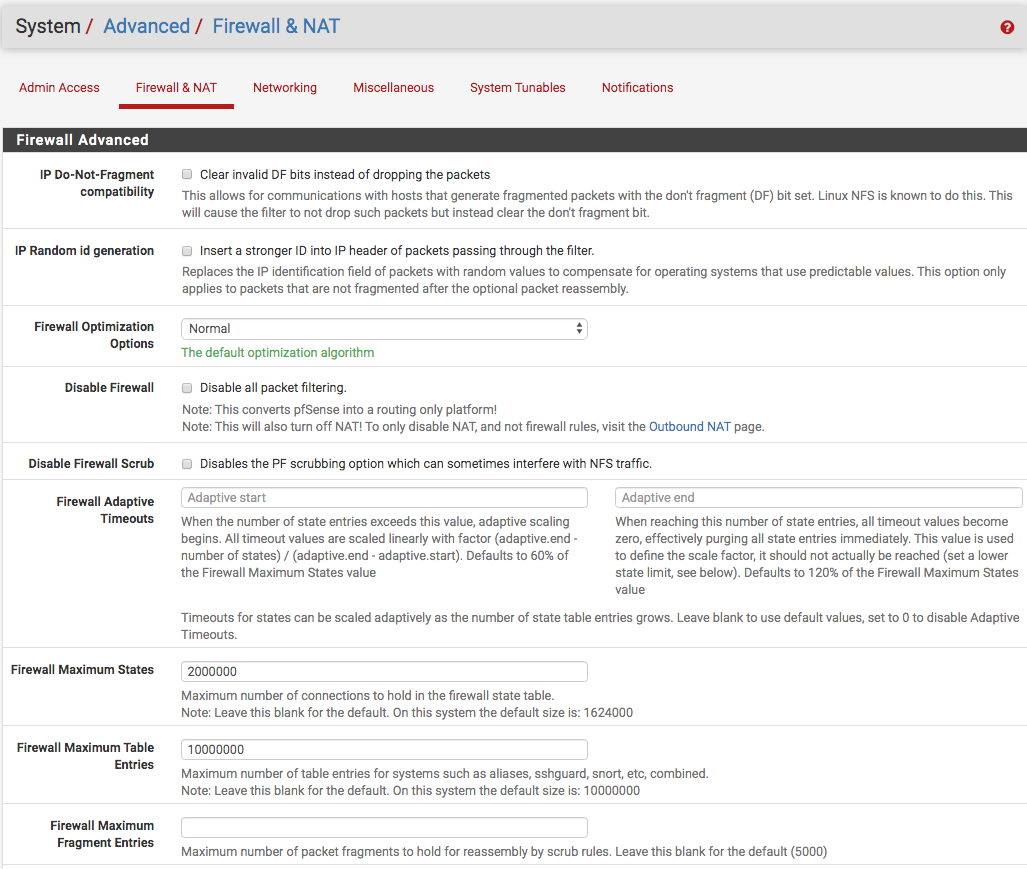
@nopro To me, it seems that you might have hardware issue such as a memory module going bad or you need to increase firewall maximum state...since the memory usage does down from 85% to 25% on reload, I believe it could be the latter...I am on pfSense 2.5-dev which has a higher default in image below...when I was on V.2.4.4, I had mine at two millions.
-
@NollipfSense Thanks for the suggestion of increasing states/table entries. I will give it a try.
Although, as described in my initial post, my system seems to use a disproportionately low amount of memory about two hours after reload, it seems to apply TLD filtering adequately, as far as I can discern from looking at my Reports/Alerts/DNSBL log... Still puzzled...
EDIT: Of course, I might not know about packets escaping filtering and thus logging, yet the log appears to be populated in a plausible manner.