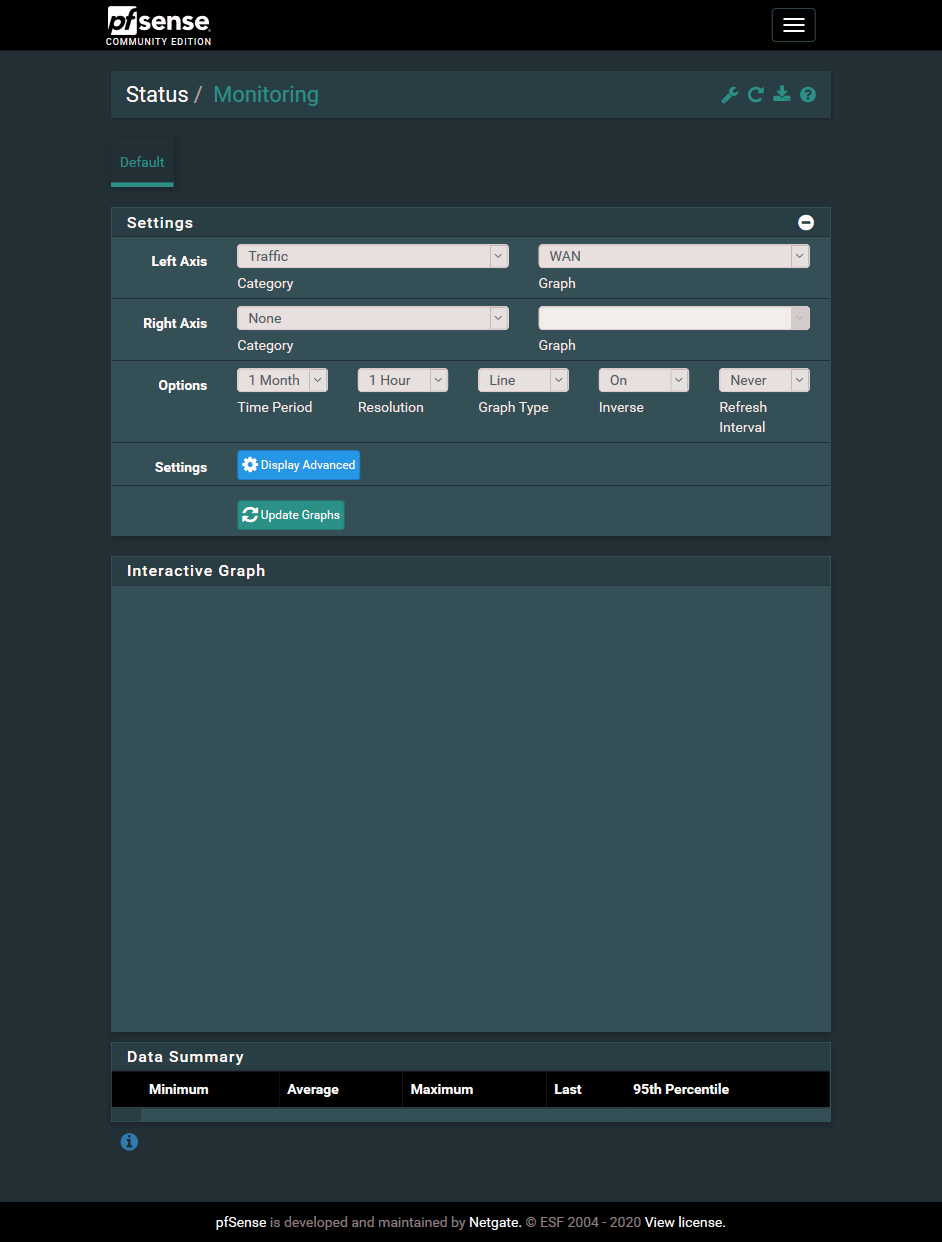
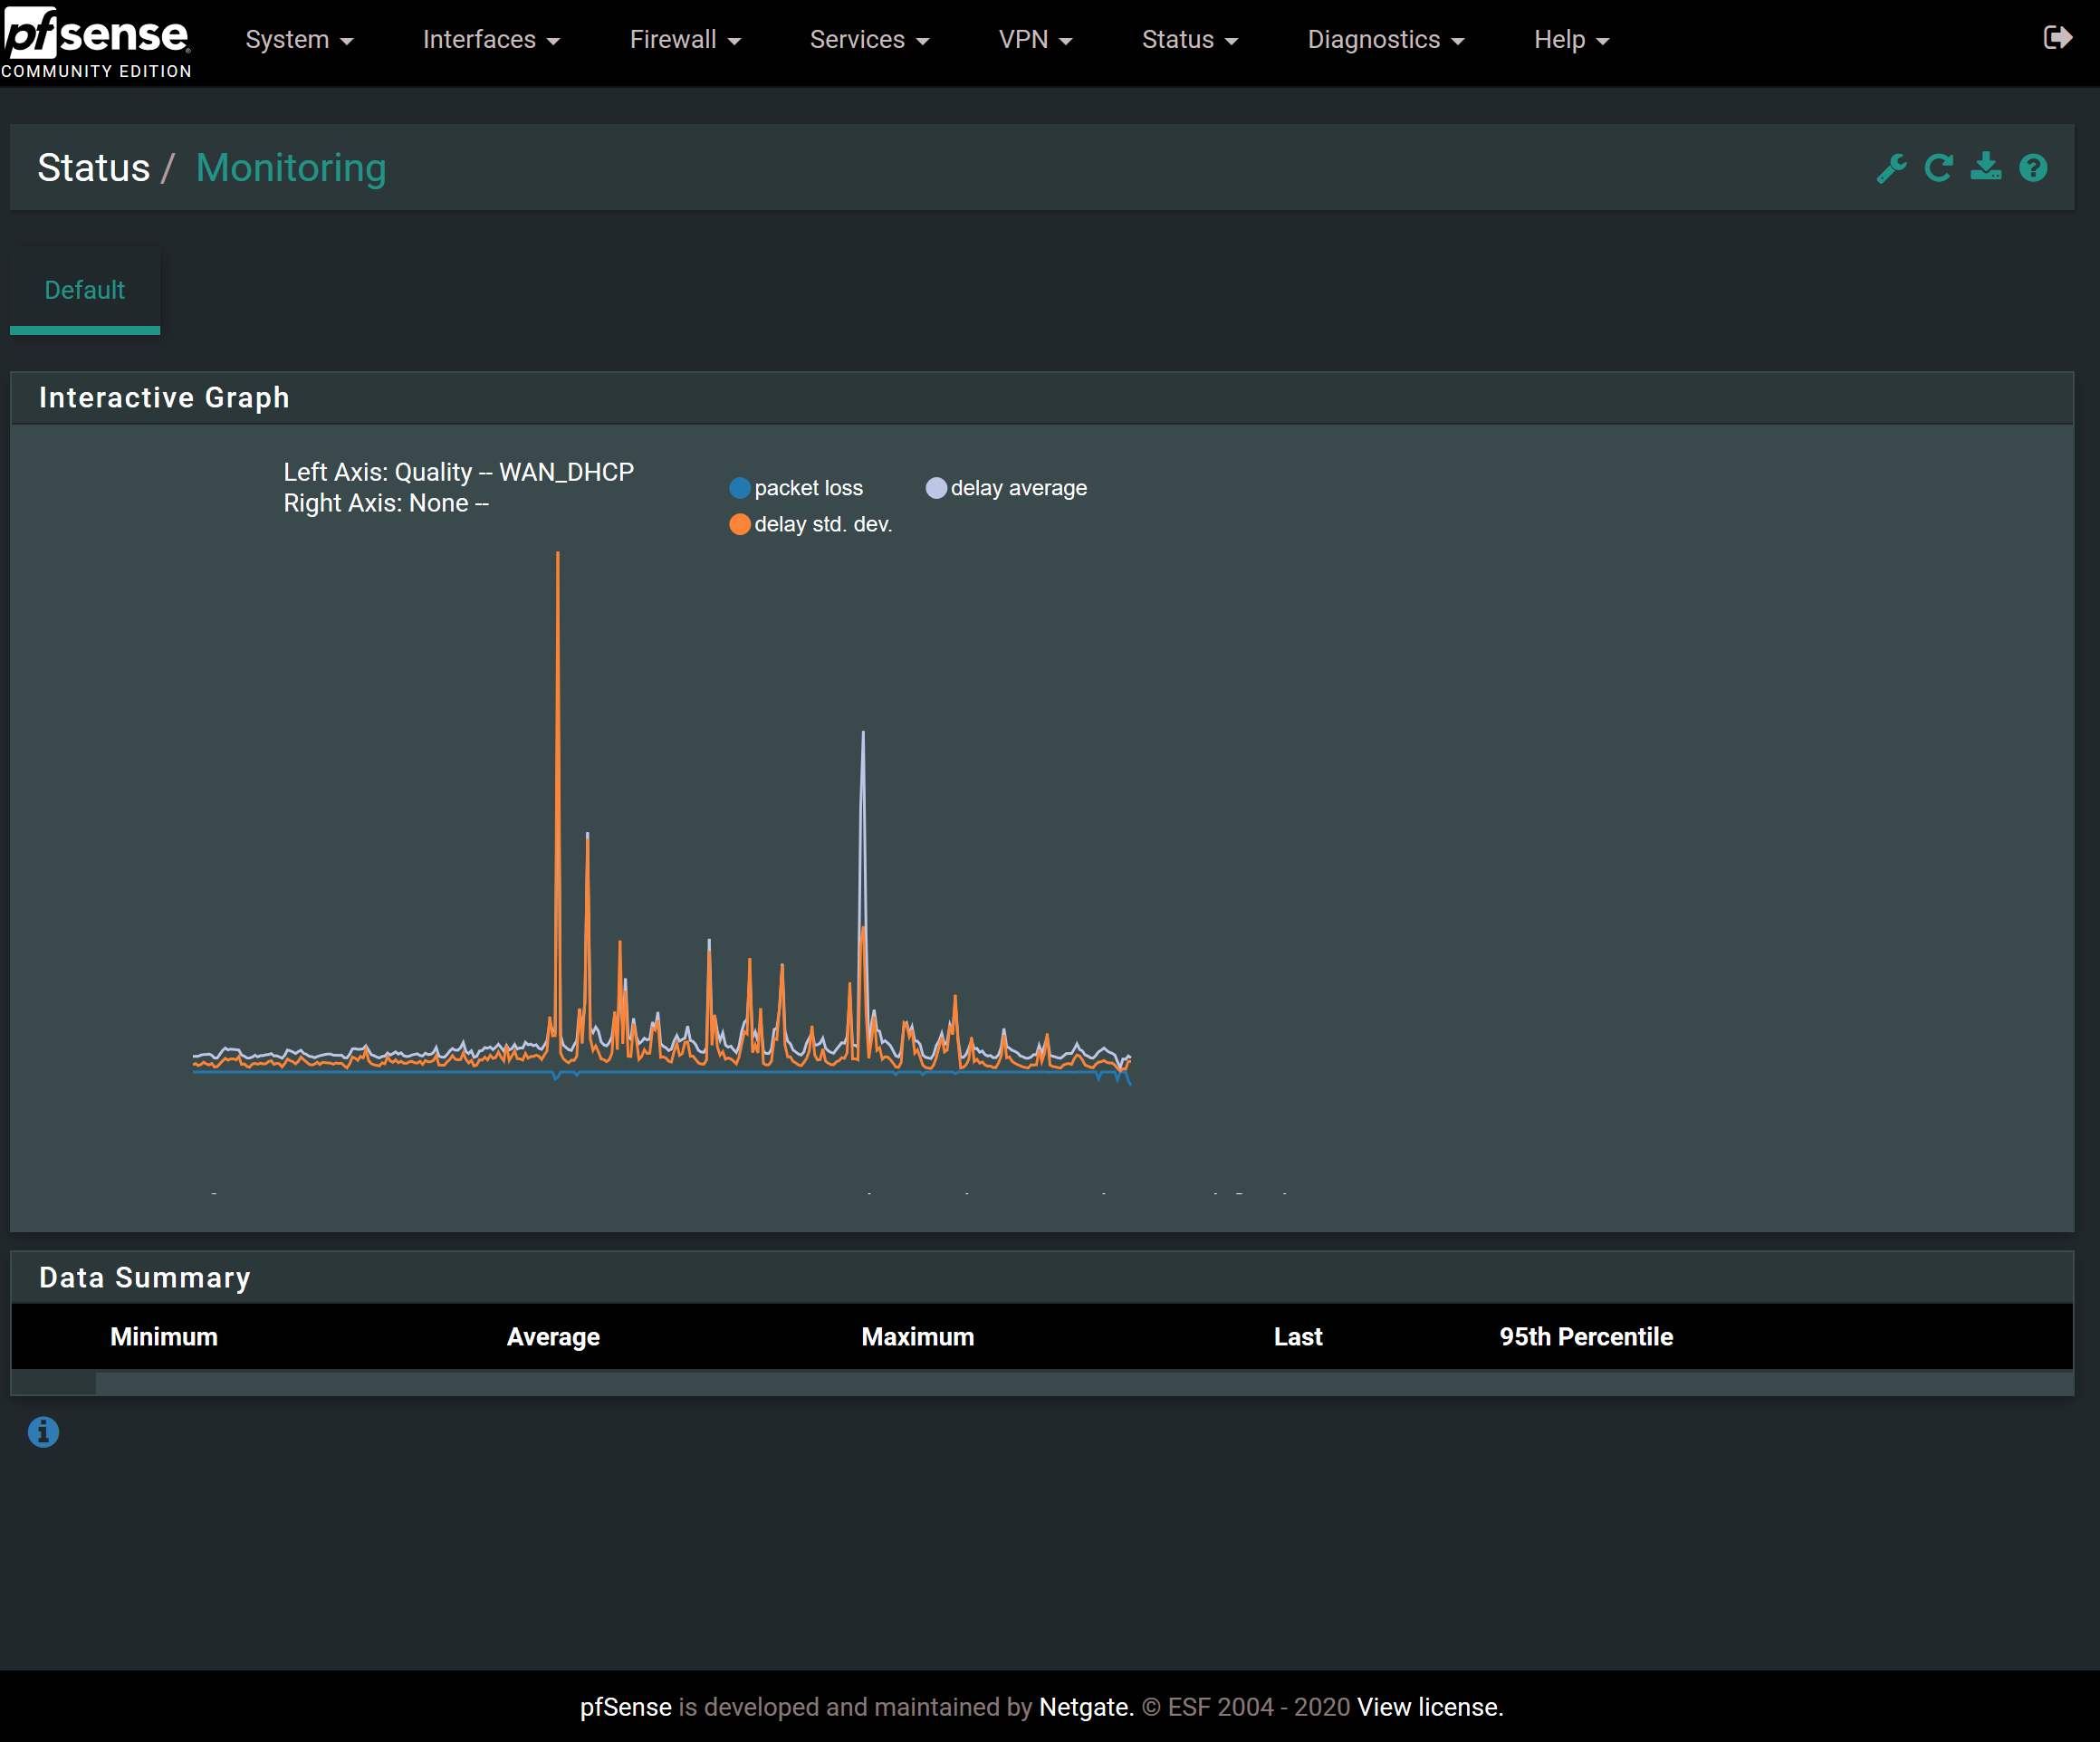
Status: Monitoring is completely broken, pfSense 2.4.5
-
@scurrier : check System > Routing > Gateways
IS WAN really WAN (an old interface name ?) and now called WAN_DHCP ? (example) ?
What are the gateway names ?
Is monitoring activated for them ?edit :
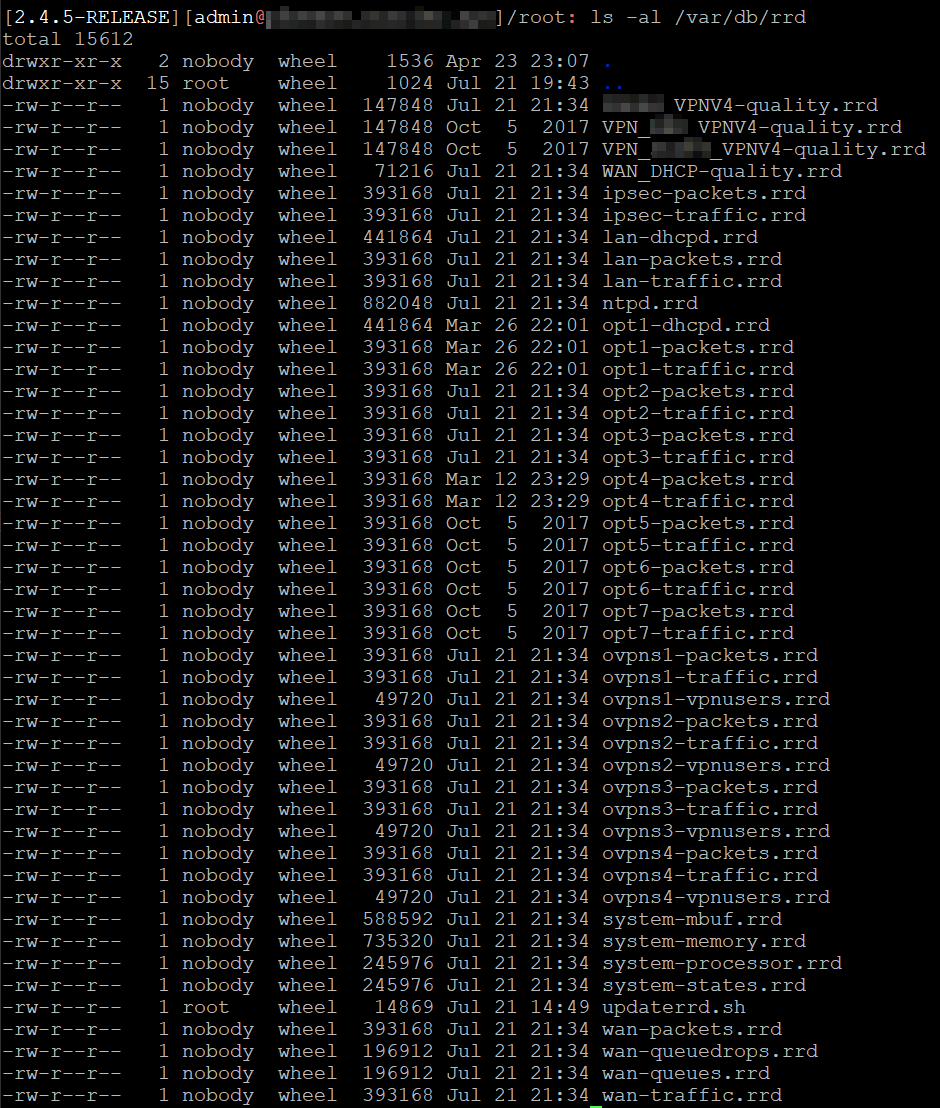
ls -al /var/db/rrdold, abandoned rrd files (== abandoned interface names) might exist.
-
Coming back to this issue since I am wanting to see just how unreliable my ISP has been since COVID-19 and I want to use the quality graphs to do it.
Regarding the security warning I mentioned earlier, that was just because I was accessing the web gui using a host name that I didn't put in the certificate. I tried using the IP I put in the certificate Common Name and now the browser fully accepts it:
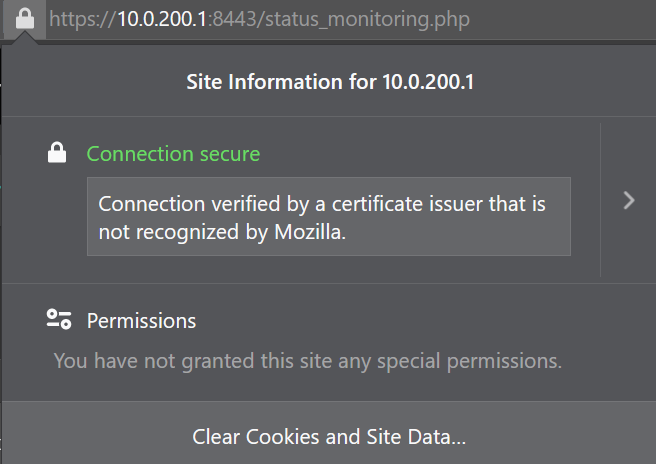
...yet, the problem persists.
@Gertjan said in Status: Monitoring is completely broken, pfSense 2.4.5:
@scurrier : check System > Routing > Gateways
IS WAN really WAN (an old interface name ?) and now called WAN_DHCP ? (example) ?
What are the gateway names ?
Is monitoring activated for them ?edit :
ls -al /var/db/rrdold, abandoned rrd files (== abandoned interface names) might exist.
Thanks for your post. Sorry I somehow missed it earlier. To answer your questions:
Here's the WAN gateway:

When I have the Category of the Monitoring set to Packets or Traffic, I see WAN in the Graph dropdown. When I change the Category to Quality, I see WAN_DHCP. I guess that's because some Categories deal with Gateways and others deal with Interfaces. My WAN_DHCP gateway is on the WAN interface. Seems OK to me.


Here's my RRD files.
-
Oh, snap. Looks like this bug #7656 is exactly what I'm encountering. The line numbers are different, but for me line 1142 of status_monitoring.php involving the same variables the bug discusses and they appear to be the culprit for me.
I don't know JavaScript or how to debug it in a browser, but I can fiddle with the best of 'em.
I set a breakpoint on 1141 of status_monitoring.php. This shows that
timeFormatis undefined.

The reason
timeFormatis undefined appears to be thatdata[0].stepis7200...

...yettimeLookupdoes not contain this value:
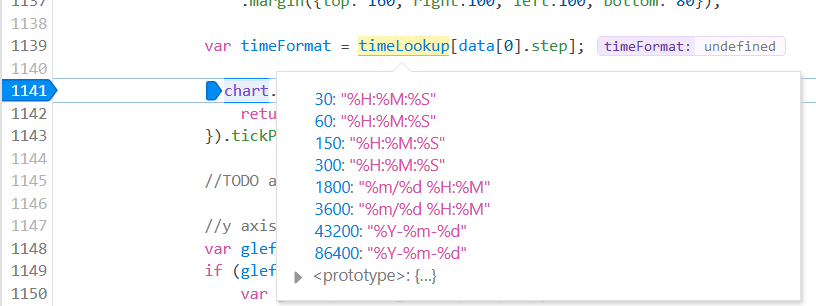
So... yada, yada, yada, this causes my problem?
-
@scurrier said in Status: Monitoring is completely broken, pfSense 2.4.5:
The line numbers are different
That code is very ancient.
What about hitting Ctrl-F5 to force-flush the browser cache - or even flush the cash, or use another browser to reproduce. -
@Gertjan I just confirmed that Ctrl + F5 does not solve the issue.
I've previously tried other browsers, no luck. It's a bug.
-
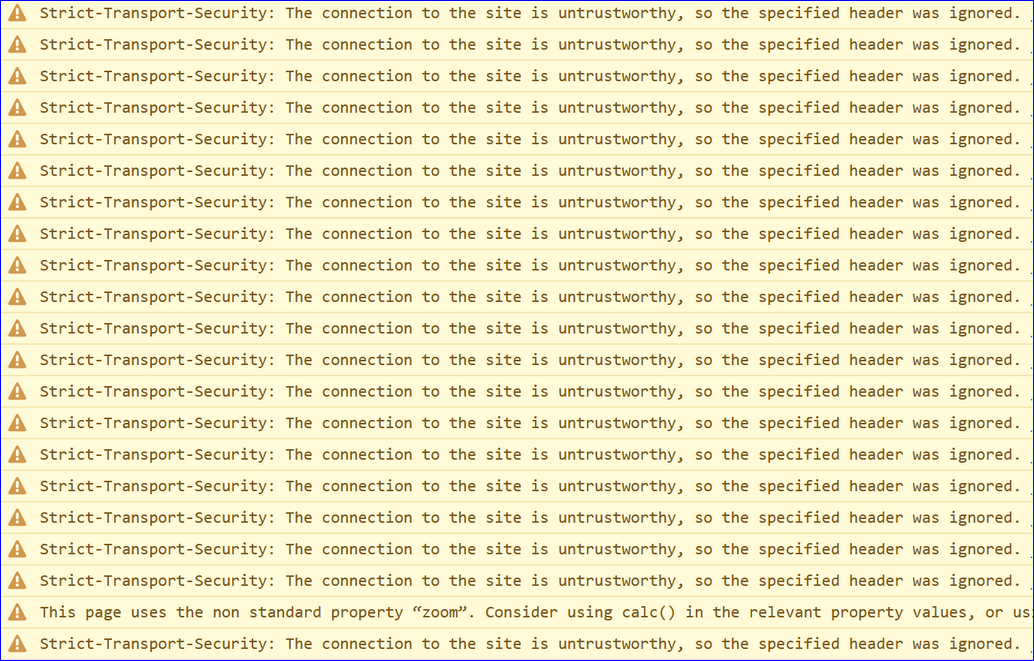
Were you using HTHS in the past (the browser you are using thinks so !) ? If so, the browser will recall that, and refuse new, non HSTS certificate. Which means that js files won't get loaded -> I'm reading out loud the messages from your logs - , which means functions and variables are not defined. That's what your issue is all about.
Ctrl-F5 will not wipe browser's SHTS memory. To wipe that one : go Google.

I known that IP's can be put into the SAN of a cert (some cert authorities are refusing that).
IMHO : bad practice. With upcoming IPv6 some what totally not manageable anyway.What happens when you use a 'real' certificate, one that is signed by a known CA ?
Letsencrypt gives them for free this week !Another thing to check : all pfSense files are actually updated, upgraded ?
A clean install could eliminate this question. -
I would just set pfsense to not do https, hit via just plain jane http... Clear all the hsts stuff from your browser... Do you have issues now?
Crazy shit is going to happen if your js are not loading..
this takes all your certs and exceptions and non san in your certs out of the equation... I run my own ca on pfsense and create my own certs.. But It just seems problematic to do hsts on web gui that is only accessible by me, from my own secure network.. Currently its enabled, since I didn't check the box... But if your having issues loading stuff and your seeing errors about strict-transport-security... Then take that out of the equation for "testing".
-
@johnpoz said in Status: Monitoring is completely broken, pfSense 2.4.5:
But It just seems problematic to do hsts on web gui that is only accessible by me, from my own secure network.
Very true.
But it's is a button. So it takes hits, euh ... clicks ...
-
Being a security device, best practice is to enable security features like HSTS. Doesn't matter how (un)exposed the GUI is or where it can be reached from. Sure, you could use HTTP and telnet locally if you really wanted on an isolated management network, but it's better to do it as securely as possible.
-
I can't check at the moment, but I am pretty sure the HSTS warning was there because I was accessing the webgui via a new host name that was not in the certificate. I made an exception in the browser to do this. Because of that, the browser rightly rejected the HSTS header because it didn't trust the site enough to honor such a permanent policy as HSTS.
I doubt HSTS has anything to do with this and I believe I've demonstrated the smoking gun above.
-
@Gertjan @jimp oh I think maybe you guys took that wrong... I mean that in this context that its problematic to also have that variable at play... When your trying to figure out something in a gui having issues.
And your tools are just 1 long flood of hsts errors - that is problematic for troubleshooting ;)
If your not having any issues sure common security practices should be default... Should of worded that better... I meant that since its not public, there is no "concern" with turning it off for testing..
-
@johnpoz said in Status: Monitoring is completely broken, pfSense 2.4.5:
@Gertjan @jimp oh I think maybe you guys took that wrong... I mean that in this context that its problematic to also have that variable at play... When your trying to figure out something in a gui having issues.
And your tools are just 1 long flood of hsts errors - that is problematic for troubleshooting ;)
If your not having any issues sure common security practices should be default... Should of worded that better... I meant that since its not public, there is no "concern" with turning it off for testing..
I bet they knew what you meant, but they just took advantage of a rare opportunity to jack you up a little bit ...
 .
. -
Can anyone comment on the apparent smoking gun bug I found in the loaded, running JavaScript?
-
Sure many people would - if they could actually duplicate it... Which I can not.
Tried multiple time frames from the dropdown, custom time frames.. All display just fine.
-
To remove any shadow of a doubt, I fixed my certificate so that there are no warnings given by the browser and no exception is required. Still, the same bug persists.
-
If you are the only one seeing the issue, then its something unique to your setup/config/devices that is not actually a bug.. If it is - its very isolated to specific XYZ that all have to fall into place.
Your currently running 2.4.5p1?
You have done a clean install, and your still seeing the problem? Then why are the boards not flooded with people reporting the same problem? It's not like the monitor page is some buried odd ball thing that only 0.1% of users use ;)
Are you running some browser addons? Have you tweaked your setup in some fashion? I would love to be able to duplicate your issue.. But have tried all kinds of things and it just works as it suppose to..
To me a bug is something when you do X, it doesn't do what it suppose to, or it does it in a fashion its not suppose to.. It really needs to be repeatable for anyone to look into what is causing it.
-
I was able to perform open heart surgery on the running PHP in Firefox's F12 pane and get it to work successfully.
I did this by setting a breakpoint at line 1141 of
status_monitoring.phpand then going to console and enteringvar timeFormat = "%m/%d %H:%M". I chose this value because it matches thetimeFormatfor a time resolution of3600as seen in thetimeLookupdata structure, which is close to mydata[0].stepvalue of7200. Then, I unpaused from the breakpoint and it just worked like normal.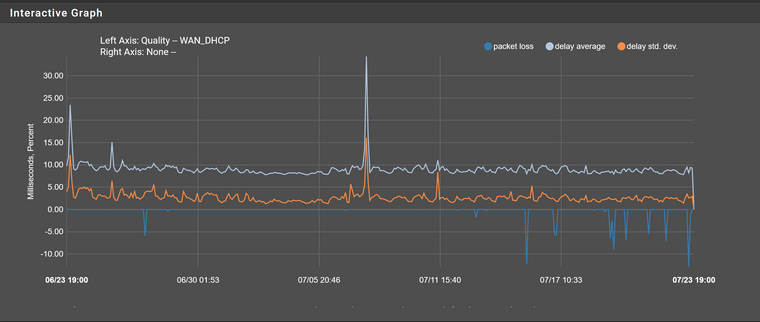
Here's what the
datavariable contains, you can see the problematic7200value there.

I tried to follow back the
datavariable and see where it came from, but it ends up in what looks like some PHP anonymous function call or something that I don't understand. I'm pretty sure it's a representation of the data from the .rrd file itself. I'm not sure if the value comes from the .rrd file itself or from the tool that parses it, though.(Side note: I just realized that I was previously referring to the PHP as JavaScript. Shows what I know...)
-
The POST involving
rrd_fetch_json.phpseems to have the expected resolution of3600. So I think something funny is happening insiderrd_fetch_json.php. Not positive, though.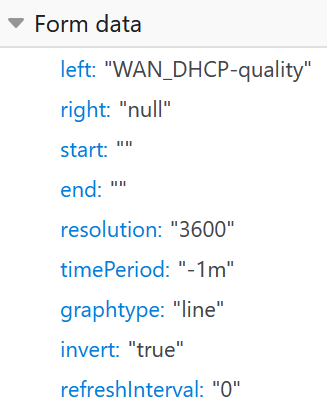
-
Figured out where the problematic value of
7200was coming from. It's from the RRD file itself when queried in rrd_fetch_json.php line 168 with therrd_fetch()function and the options deriving from the POST data I attached in a picture above. I constructed therrdtool fetchcommand that should result from that POST data and ran it on the command line against the file directly:me@my-machine:~/pfsense$ rrdtool fetch rrd/WAN_DHCP-quality.rrd AVERAGE -r 3600 -s now-1m+1hour -e 1595460745-1hour loss delay stddev 1592978400: 0.0000000000e+00 1.5691636408e-02 6.2196527951e-03 1592985600: 0.0000000000e+00 9.1416309671e-03 2.7422781960e-03 1592992800: 0.0000000000e+00 8.8436429234e-03 2.5432010581e-03 1593000000: 2.6234902083e-02 9.2394222539e-03 3.5694343962e-03 1593007200: 5.2510052500e-02 1.0458579000e-02 4.6231059930e-03 1593014400: 0.0000000000e+00 1.0825514267e-02 4.7963684750e-03 <snip> 1595419200: 0.0000000000e+00 8.0070629420e-03 1.7023876495e-03 1595426400: 0.0000000000e+00 8.5285815145e-03 2.3826874231e-03 1595433600: 7.1014380729e+00 8.6965289475e-03 2.7509416831e-03 1595440800: 4.1289524583e-02 8.8894945167e-03 2.6180607746e-03 1595448000: 6.1264454861e-02 8.7516545776e-03 2.4379814676e-03 1595455200: 0.0000000000e+00 8.6976092202e-03 2.6467615867e-03 1595462400: -nan -nan -nanThe values to the left of the colons are some kind of timestamp in seconds. If you look at the difference between them, you'll see it's 7200. I believe
rrd_fetch()function is using that difference to determine astepproperty for the result that is used on line 174 . Later, this data is referenced asdata[0].stepon line 1139 ofstatus_monitoring.phpas shown in my post from 2 days ago and the problem occurs when there's no matching key intimeLookup.So, here we have traced the problem all the way back to the RRD file itself. Looks like this potential step size was not anticipated and so was not included in the
timeLookuparray. My firewall has been running for 6 years, so maybe that length of time has something to do with it? Resolution has decreased as things filled up? I don't know. The good news is that it appears the fix is as easy as adding a line totimeLookupto account for it. Either that or diving really deep into RRD tool or the place where RRD tool is invoked to create the files and figure out if anything there could be causing it. I don't plan on doing that. -
The
rrdtool fetchdocumentation even describes that the resolution argument may not be honored. That's what's happening here. We asked for resolution 3600, but it's not honored.--resolution|-r resolution (default is the highest resolution) the interval you want the values to have (seconds per value). An optional suffix may be used (e.g. 5m instead of 300 seconds). rrdfetch will try to match your request, but it will return data even if no absolute match is possible.
