• Categories
  • Recent
  • Tags
  • Popular
  • Users
  • Search
  • Register
  • Login
Netgate Discussion Forum
  • Categories
  • Recent
  • Tags
  • Popular
  • Users
  • Search
  • Register
  • Login

Grafana Dashboard using Telegraf with additional plugins

Scheduled Pinned Locked Moved pfSense Packages
173 Posts 28 Posters 70.5k Views
Loading More Posts
  • Oldest to Newest
  • Newest to Oldest
  • Most Votes
Reply
  • Reply as topic
Log in to reply
This topic has been deleted. Only users with topic management privileges can see it.
  • V
    VictorRobellini
    last edited by VictorRobellini Apr 26, 2021, 6:18 PM Apr 4, 2020, 8:23 PM

    I want to share the Grafana dashboard I've been building. It utilizes pfSense with the Telegraf package. I've been using github to track all of my changes and manage the plugins.

    The dashboard is build using variables so there should be no need to adjust any of the queries for your system. Just make sure to select the proper datasource when you import the dashboard. I've also included some additional plugins to get more information. All of this is documented in my github page as well as instructions to set everything up.

    If you have any other data points to add I would be very interested in adding them. Ideally, just fork the repo and submit a merge request.

    Setup info:
    Repo URL: https://github.com/VictorRobellini/pfSense-Dashboard

    See the GitHub page for version information

    Screenshot

    Thanks

    D D 2 Replies Last reply Apr 3, 2021, 1:50 PM Reply Quote 11
    • K
      kiokoman LAYER 8
      last edited by Apr 4, 2020, 9:10 PM

      nice 😂

      ̿' ̿'\̵͇̿̿\з=(◕_◕)=ε/̵͇̿̿/'̿'̿ ̿
      Please do not use chat/PM to ask for help
      we must focus on silencing this @guest character. we must make up lies and alter the copyrights !
      Don't forget to Upvote with the 👍 button for any post you find to be helpful.

      1 Reply Last reply Reply Quote 1
      • B
        bigjohns97
        last edited by bigjohns97 Apr 6, 2020, 6:09 PM Apr 6, 2020, 5:28 PM

        First off, this is an awesome dashboard, as someone who recently moved from UNIFI UDMP / PiHole to pfSense the only thing I am really missing is the pretty dashboards I used to see, I already have a system performance dashboard up but I would really like to see some of the security options you have laid out.

        Would it be possible to show the top DNS clients as well as top allowed DNS requests, I always liked seeing this in PiHole and it was very useful when trying to find out who was being too chatty with my DNS servers.

        Awesome work, I am going to start implementing this right away!

        EDIT : wow this works like a charm, great instructions!

        V 1 Reply Last reply Apr 7, 2020, 12:21 AM Reply Quote 1
        • J
          JohnKap
          last edited by Apr 6, 2020, 10:52 PM

          Looks great, thanks for sharing. Will have a go at this myself.

          1 Reply Last reply Reply Quote 2
          • V
            VictorRobellini @bigjohns97
            last edited by Apr 7, 2020, 12:21 AM

            @bigjohns97 I don't know if that information is even being logged. I believe the dnsbl.log only logs what has been blocked. You could maybe get that data from Unbound. It would require additional logging, but even then I don't know if you would be able to differentiate between a blocked vs allowed domain. If you have a datasource, I'll take a look but I don't know if there is one.

            1 Reply Last reply Reply Quote 0
            • B
              bigjohns97
              last edited by Apr 7, 2020, 7:45 AM

              Any idea why I would be getting the following when trying the telegraf_gateways.py option?

              [inputs.exec] Error in plugin: exec: fork/exec /usr/local/bin/telegraf_gateways.py: no such file or directory for command '/usr/local/bin/telegraf_gateways.py'

              V _ 2 Replies Last reply Apr 7, 2020, 2:13 PM Reply Quote 0
              • V
                Vikonder
                last edited by Apr 7, 2020, 11:09 AM

                Hi

                Do you have at option on dashboard to calculate files count in specific folder?

                V 1 Reply Last reply Apr 7, 2020, 2:11 PM Reply Quote 0
                • V
                  VictorRobellini @Vikonder
                  last edited by Apr 7, 2020, 2:11 PM

                  @Vikonder Building shell based plugins is really easy. Just look at the temperature plugin.

                  Something like this will do it, all you need to do is wrap it in a shell script and replace the hostname with a variable like I did in the temperature script.

                  find /var -d -print0 -exec sh -c "ls -1 {} | wc -l " \; | xargs printf 'files,host=hostname,directory=directory=%s filecount=%s\n'
                  
                  1 Reply Last reply Reply Quote 1
                  • V
                    VictorRobellini @bigjohns97
                    last edited by Apr 7, 2020, 2:13 PM

                    @bigjohns97 Have you tried executing it from a shell on it's own?

                    B 1 Reply Last reply Apr 7, 2020, 2:19 PM Reply Quote 1
                    • B
                      bigjohns97 @VictorRobellini
                      last edited by Apr 7, 2020, 2:19 PM

                      @VictorRobellini yes actually messing with it right now, was able to get a little further by updating the referenced python version in the script to 3.7 which seems to be the version included 2.4.5 of pfSense. Doing this I now get this when running via command line.

                      File "./telegraf_gateways.py", line 17
                      print "gateways,gateway_name=" + values[0] + " rtt=" + str(int(values[1])/100.0) +
                      ^
                      SyntaxError: invalid syntax

                      V 1 Reply Last reply Apr 7, 2020, 2:23 PM Reply Quote 1
                      • V
                        VictorRobellini @bigjohns97
                        last edited by Apr 7, 2020, 2:23 PM

                        @bigjohns97 If you transferred this from a windows box, you may want to check your carriage returns.

                        B 1 Reply Last reply Apr 7, 2020, 2:28 PM Reply Quote 0
                        • B
                          bigjohns97 @VictorRobellini
                          last edited by bigjohns97 Apr 7, 2020, 2:34 PM Apr 7, 2020, 2:28 PM

                          @VictorRobellini I checked that, all clear.

                          I'll keep looking.

                          EDIT : I thought you were talking about the added junk that sometimes gets added to files when going back and forth through windows and linux, I don't see any of that when I vi the interfaces script (I do see it in the telegraf.conf file BTW but only with the entries from the extra config section of the GUI).

                          Are you saying that should be in there or that it shouldn't?

                          V 1 Reply Last reply Apr 7, 2020, 3:33 PM Reply Quote 1
                          • V
                            VictorRobellini @bigjohns97
                            last edited by Apr 7, 2020, 3:33 PM

                            @bigjohns97 said in Grafana Dashboard using Telegraf with additional plugins:
                            On linux you can run "cat -A filename'. I don't think the cat in pfSense has the same capability. When in doubt, just the tr command against the file, all it should be doing is replacing the carriage returns, so running it on a valid file will have no impact. Even running it multuple times will have no impact.

                            B 1 Reply Last reply Apr 7, 2020, 3:38 PM Reply Quote 1
                            • B
                              bigjohns97 @VictorRobellini
                              last edited by Apr 7, 2020, 3:38 PM

                              @VictorRobellini does that script work for you? if so, what version of pfSense are you running?

                              My research tells me that it will have to be re-written due to some new way that python converts certain data to bytes before sending, but I am not very knowledgeable about this stuff. I posted something to the github link from the original author to see if he knows what might be the issue.

                              1 Reply Last reply Reply Quote 1
                              • B
                                bigjohns97
                                last edited by Apr 12, 2020, 12:56 AM

                                https://gist.github.com/fastjack/a0feb792a9655da7aa3e2a7a1d9f812f

                                Looks like FastJack uploaded an edited version that works with PFS 2.4.5 that comes with python 3.7

                                V 2 Replies Last reply Apr 12, 2020, 1:16 AM Reply Quote 1
                                • V
                                  VictorRobellini @bigjohns97
                                  last edited by Apr 12, 2020, 1:16 AM

                                  @bigjohns97 Awesome! I'll update the repo shortly.

                                  1 Reply Last reply Reply Quote 1
                                  • V
                                    VictorRobellini @bigjohns97
                                    last edited by Apr 13, 2020, 2:29 PM

                                    @bigjohns97 Thanks again, I've updated the repo with some basic instructions. How are you showing the measurements in the dashbord? When I tried converting from microseconds to milliseconds things didn't look right.

                                    B 1 Reply Last reply Apr 13, 2020, 3:32 PM Reply Quote 0
                                    • B
                                      bigjohns97 @VictorRobellini
                                      last edited by bigjohns97 Apr 13, 2020, 4:24 PM Apr 13, 2020, 3:32 PM

                                      @VictorRobellini said in Grafana Dashboard using Telegraf with additional plugins:

                                      @bigjohns97 Thanks again, I've updated the repo with some basic instructions. How are you showing the measurements in the dashbord? When I tried converting from microseconds to milliseconds things didn't look right.

                                      I am using the default microseconds, I don't specify an ip address so it uses my WAN default gateway which does show in microseconds which I think is nice.

                                      I really don't need to see 1ms it's more useful to 4-8 microseconds even though the difference is very small, kinda lets you know when you start reaching the limits of your connection.

                                      BTW it looks like the graph will switch back to milliseconds as soon as the value gets that high and then it goes back to micro once things calm down.

                                      1 Reply Last reply Reply Quote 0
                                      • J
                                        JohnKap
                                        last edited by JohnKap Apr 15, 2020, 12:55 AM Apr 15, 2020, 12:51 AM

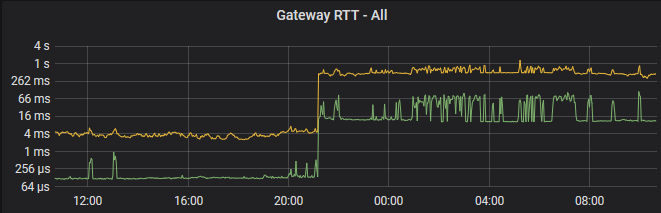
                                        I'm not sure if it's something on my system, but I needed to modify the telegraf_gateways.py script.

                                        Changed this:

                                            print("gateways,gateway_name="+values[0]+" rtt="+str(int(values[1])/100.0)+ \
                                                  ",rttsd="+str(int(values[2])/100.0)+",loss="+str(int(values[3]))+"i")
                                        

                                        to this:

                                            print("gateways,gateway_name="+values[0]+" rtt="+str(int(values[1])/1.0)+ \
                                                  ",rttsd="+str(int(values[2])/1.0)+",loss="+str(int(values[3]))+"i")
                                        

                                        The figures displayed are now correct and match what is displayed on the pfsense dashboard.

                                        • Green is my ISP connection, sits at ~10ms.
                                        • Yellow is a VPN tunnel to the other side of the world and ~400ms is about right.

                                        2fa9d679-fdf8-4226-9f5f-bc5842353bb4-image.png

                                        B V 2 Replies Last reply Apr 15, 2020, 12:58 AM Reply Quote 2
                                        • B
                                          bigjohns97 @JohnKap
                                          last edited by bigjohns97 Apr 15, 2020, 12:59 AM Apr 15, 2020, 12:58 AM

                                          @JohnKap after actually pinging the address from a machine that shows below 1ms you are correct, I never went and actually checked the accuracy of this.

                                          LOL at me thinking I had 8 microseconds to my first hop 😂

                                          1 Reply Last reply Reply Quote 2
                                          20 out of 173
                                          • First post
                                            20/173
                                            Last post
                                          Copyright 2025 Rubicon Communications LLC (Netgate). All rights reserved.
                                            This community forum collects and processes your personal information.
                                            consent.not_received