PfBlockerNG high CPU
-
after upgrading to 2.4.5-P1 things become even worse.
I had to switch off PfBlockerNG because the high CPU load resulted in packet loss and very bad DNS resolution times.I´m currently installing Pihole in a VM. Hopefully this issue will be fixed soon, so that PfBlockerNG can be used again.
(As far as i understood it might be a general 11.3 release issue. Therefore I guess I have to wait for release 12) -
Can you check if everythuing goes fine with one small list like :

Wait a day or so, see if it is stable.
If ok, add another list :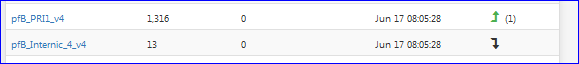
and re test - be patient.
Etc.
Raise the number of feeds, or more important : the number of IP/DNSBL step by step.
Btw : open the manual, and do a file consisty check.
edit : better : have a look at the latest official Netgate's video. Do as instructed. -
@Gertjan Hi, thank you for your help.
I executed the fsck command in single user mode as explained in the vid.
No issues where found (done it 3 times :))with the IP block lists i have no issue. The issue with high CPU (and load average > 2.0) starts when i use DNSBL for ad blocking.
You say i should raise the number of feeds slowly and see what happens. I was using the default lists from the feed.
BR
Frosch1482 -
@Frosch1482 said in PfBlockerNG high CPU:
The issue with high CPU (and load average > 2.0) starts when i use DNSBL for ad blocking.
The issue is :
@Frosch1482 said in PfBlockerNG high CPU:
IP block lists
To many ..... hundreds of thousands IP's and domain nmaes, handles by PHP does take even a powerful system to a crawl.
Any system can download them fast.
But the sorting, weeding out the doubles, preparing the files so unbound can read them etc, takes time.
Then unbound has to build it's internal structures so it can work with them .... that takes time.That why I propose to start with one small feeds - just a few IP's and/or DNSBL.
My question is : does the problem persist ?@Frosch1482 said in PfBlockerNG high CPU:
I was using the default lists from the feed.
What does that mean ?
By default, pfBlockerNG does not have any feeds active.
So, you activated one of them ?
All of them ? -
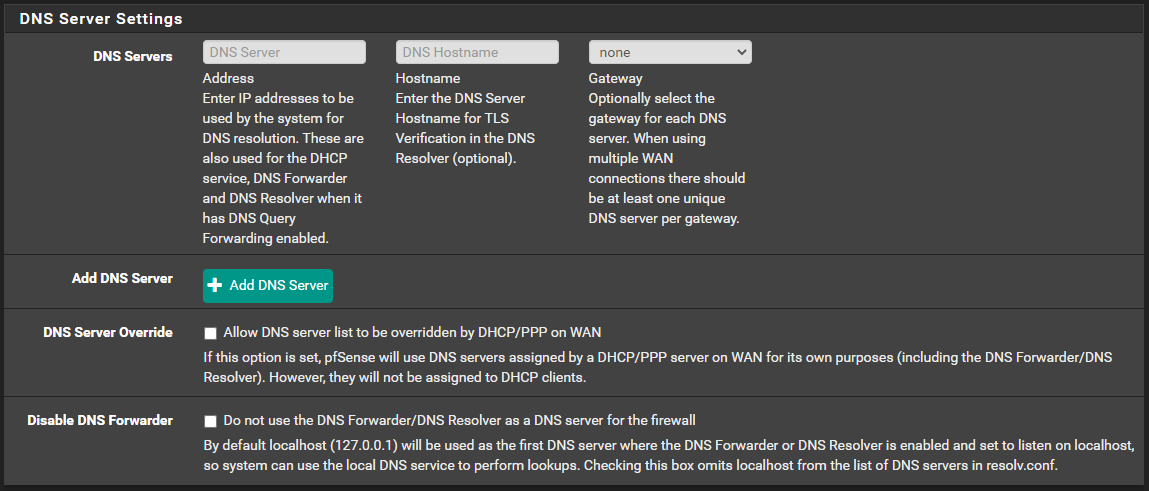
Are you using unbound and not the forwarder?
Delete any DNS related stuff under system -> general. It will make pfblocker significantly quicker since it doesnt have to resolve to external dns
-
Done!
-
How does that work if we remove the servers from System > General? The DNS Resolver uses those to forward queries, so name resolution fails completely when I do that.Fixed. It helps not to use a VPN interface that depends on name resolution for name resolution.I too am testing this with just a single list to start. It would be a bit disappointing if pfblockerng could not handle the load, considering I was previously using Pihole on a Raspberry Pi Zero with a million domains in the blocklist without issue. I've got pfSense on an Odyssey X86 which is significantly more powerful.
-
@lunaticfringe80 said in PfBlockerNG high CPU:
How does that work if we remove the servers from System > General? The DNS Resolver uses those to forward queries, so name resolution fails completely when I do that.
I too am testing this with just a single list to start. It would be a bit disappointing if pfblockerng could not handle the load, considering I was previously using Pihole on a Raspberry Pi Zero with a million domains in the blocklist without issue. I've got pfSense on an Odyssey X86 which is significantly more powerful.
It works for the rest of us :) Something is worng in your setup.
-
@Cool_Corona The DNS issue was a dumb oversight. Unbound was set to go out on a VPN interface with a domain name which of course won't work if it can't resolve the name. I appreciate the helpful reply, though.
The real issue here is the pfblockerng performance, which doesn't seem to be working for everyone.
-
@lunaticfringe80 said in PfBlockerNG high CPU:
@Cool_Corona The DNS issue was a dumb oversight. Unbound was set to go out on a VPN interface with a domain name which of course won't work if it can't resolve the name. I appreciate the helpful reply, though.
The real issue here is the pfblockerng performance, which doesn't seem to be working for everyone.
No worries. I get that, but we need to eliminate a lot of things first to get to the problem.
What packages are you running and are you using thePFB Devel or std. package?
-
I've tried both so far. Currently testing the devel package, and the problem has just re-emerged.

What I did was uncheck the box to keep settings, completely uninstalled pfblockerng-devel, reinstalled pfblockerng-devel. I ran the wizard, and then went in to the feeds and disabled all but just one feed per group, leaving the top one in each. I set the update frequency to once a day and then entered my maxmind key. Then I ensured pfblockerng and dnsbl were both enabled. It was fine for about 5 hours and then it begins again. There's correlating state table usage as well:

Now here it is over the past 5 days. The first group is from the standard pfblockerng package, second group is from the devel package.

It just keeps repeating that pattern until I restart it, then it comes back within minutes to hours.
I've tested it with and without suricata, snort, squid, badnwidthd, darkstat, apcupsd, and clamd running. I've run it with none of those, and variations of different ones running. No difference in result. The only other things consistently running have been openvpn and then telegraf for monitoring.
-
Have you tested LAN for malware/spyware??
Have you noticed anything suspicious in the states table???
-
This post is deleted! -
There's only two machines running windows, one is my primary desktop, and the problem happens while it is completely powered down. It gets regular scans and I'm cautious online so I'm pretty confident it's clean. The other is a work laptop that goes through corporate VPN before I even login, and these events happen while it is offline too.
Everything else runs Linux and I'm pretty confident they are not compromised.
There's a lot of IoT on the network, the two Nvidia Shield's are pretty chatty and were top of my pihole block counts in my previous setup, but if those cause this problem it would kinda defeat the purpose. Stopping devices like that from phoning home is part of why I'm sinkholing dns to begin with.
I did not realize I could directly monitor the states table, I see it in the diagnostics menu so I will watch it during these events.
-
Interesting images.
The states are not created by pfBlockerNG. These are created by network devices that start to do their thing, like nightly backups.
Just a theory :
I've seen iPhones/iPad's, that, while they hey are Wifi connected and being charged and stand-by and have the Apple's iCloud's storage activated, really hitting hard the network. That is, I've seen it on this forum. Never with on my own networks although I've the same equipment / configuration.
Also : one would be using a feed that have listed the Apple's cloud services as a DNSBL (you see the upcoming issue ??) and unbound / pfBlockerNG start to do what they are asked for. This can be seen as a huge miss configuration.
Remember what really happened to HAL - in 2001 movie ? Feed a system with information that is in contradiction,and you brings it down.Apple has many iCloud servers pre defines in it's OS, and if one is unreachable, it will try another one. Leaving a state aborted. This will add up quickly.
This is a Apple example, it could be any device type / service.You have the exact moment when its happens, this should help to determine which device is doing what at that moment.
If pfBlockerNG is not active, do you see the same state table bursts ? -
When DNSBL is disabled, the state table bursts do not happen. They only happen when it is enabled and when the correlating CPU bursts happen.
No Apple devices at all on my network, but there are several Amazon Echos.
-
@lunaticfringe80 said in PfBlockerNG high CPU:
When DNSBL is disabled, the state table bursts do not happen. They only happen when it is enabled and when the correlating CPU bursts happen.
No Apple devices at all on my network, but there are several Amazon Echos.
Around 24hrs between the bursts?? Ends at 2100hrs and begins again at 2100hrs. Then it runs for quite some time and happen 24hrs later again??
Is that about correct?
and can you disable ANYTHING other than pc's on the network?? And then turn on IoT one by one??
-
Almost exactly 1 hour between bursts. Not always exactly on the hour, sometimes a few minutes after. Looking at the previous test over the past 5 days those were starting at about 36mins after the hour. At first I thought it was the default hourly feed updates, but I have since made a point to change the updates to daily to rule that out.
-
@lunaticfringe80 said in PfBlockerNG high CPU:
Almost exactly 1 hour between bursts. Not always exactly on the hour, sometimes a few minutes after. Looking at the previous test over the past 5 days those were starting at about 36mins after the hour. At first I thought it was the default hourly feed updates, but I have since made a point to change the updates to daily to rule that out.
Its a 24hr timespan on the graph.... and states skyrocket at exactly 2200hrs.
Pretty suspicious to the point where there is definately a backup running....
-
@Cool_Corona said in PfBlockerNG high CPU:
Its a 24hr timespan on the graph.... and states skyrocket at exactly 2200hrs.
Pretty suspicious to the point where there is definately a backup running....
The first graph image is a 6 hour timespan. The blue mark on the top graph marks when I did the complete reinstall of pfblockerng-devel.
The second graph image is a 5 day timespan of the same metrics, where pfblockerng was disabled where the previous streak of bursts ended, up to the second mark on the cpu graph which matches up to the mark on the above graph image indicating where pfblockerng was enabled again.
The first mark on that second graph image was just me marking when I turned on all my systems to begin work that morning just so it could be seen when regular activity begins.