PfBlockerNG high CPU
-
@Gertjan said in PfBlockerNG high CPU:
Ass I mentioned earlier : pfBlockerNG-devel does nothing** when it runs.
pfBlockerNG-devel prepares files that are used by unbound, the Resolver.Try it yourself : leave pfBlockerNG-devel activated, but remove all feeds.
I bet : No more issues ^^** it actually does collect statistics info in the back ground all the time.
Obviously, feeds were enabled. I didn't think it was necessary to spell that out.
@Gertjan said in PfBlockerNG high CPU:
Wait ....
You are aware of the fact that most of these feeds are created by automated tools, and are free of use ?
To create them, big resources are need that do cost $$.
And imagine this one :
Me being a smart-ass, I managed to introduce an host name like : *.windowsupdate.microsoft.com on one of the feeds that you are using.
What do you thing will happens ? Except the serious huge Internet buz just I created because thousands of PC"'s can't update any more.
Because I managed to get an URL on a list.
And you are "disappointing" ? Don't be. Do what should always be done. After each setting change, be patient. Check what the results are. What do you expect to see ? What do you see ? This process goes over entire days, even weeks. humans :)You've completely lost me here. My point is that Pihole was able to handle the exact same DNS sinkholing workload I'm currently putting on pfblockerng without such a significant performance impact. I'm struggling to see how any of what is quoted above relates to that.
-
@lunaticfringe80 said in PfBlockerNG high CPU:
My point is that Pihole was able to handle the exact same DNS sinkholing workload I'm currently putting on pfblockerng without such a significant performance impact.
Then show something ?!
Like :
What do you have ?
Were the pi-hole "list" identical ?
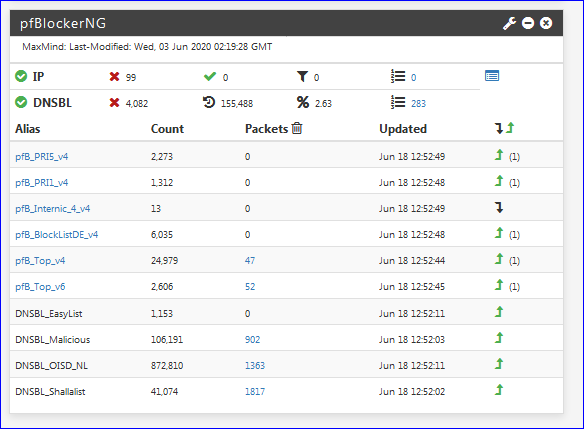
How many host names ? IP adresses ?On of your feeds (= Alais, in the image above) contains a domain name (or IP) that is blocking your devices.
These devcies don't like that, and have an entire list build in - so they try them all. They get blocked.
That's what I things is happening.Step one : remove all feeds (aliases).
The problem is still there ? (answer : no ..... of course not) but please, test this yourself.
Then add one ( 1 ! ) Alais.
re test.
Ok, add another alias / feed.
And loop.
Finally, things start to go bad. You found your alias feed that block your devices.
Cross check this with the Reports DNSBL page. You should find the domain name / host name.
White list it.
Done.Don't understand something ?
Say so.
Believe it, or not, my goal is that you understand what happens.
Nice side effect : your issue will be gone.Btw : pi-hole could be "all machine language". pfBlockerNG is all PHP.
That's interpreted language - or a thousand or more times slower. (speaking in general here).
My unbound resolver has to plough through more then 900 thousand host/domain names and IP's for every DNS request.
Using pure intel machine language (compiled C code).
These are arrays in memory that weight more then 20 Mbytes. All this many times a second...
I'm using a 12 year old "Intel(R) Pentium(R) 4 CPU 3.20GHz" .... and it works - I'm amazed. -
@lunaticfringe80 said in PfBlockerNG high CPU:
What I did was uncheck the box to keep settings, completely uninstalled pfblockerng-devel, reinstalled pfblockerng-devel. I ran the wizard, and then went in to the feeds and disabled all but just one feed per group, leaving the top one in each. I set the update frequency to once a day and then entered my maxmind key. Then I ensured pfblockerng and dnsbl were both enabled. It was fine for about 5 hours and then it begins again. There's correlating state table usage as well:
I explained what I did in the post above. I apologize for the lack of specifics, I figured it was sufficient for the purpose of reproduction. The goal was to use fewer blocklists than what the wizard sets up by default to ensure my settings weren't out of line with what I'd expect the average user to have.
I was able to test the theory that pfblockerng is simply not up to the task by whitelisting what has always been the #1 blocked domain on my network in pihole by far, api.amplitude.com which my 2015 Shield TV hits like crazy. I whitelisted that domain just before bed last night while it was between spikes. There were zero spikes after that when I checked this morning. To rule out a coincidence I've removed that from the whitelist and I'm now waiting for the Shield to start hitting that domain again to confirm. I figure if if the spikes begin again, and if I can try whitelisting it in the middle of a spike and witness the spike end instantly then that's sufficient proof for me to give up and look elsewhere for my dns sinkholing needs.
-
@lunaticfringe80 said in PfBlockerNG high CPU:
The goal was to use fewer blocklists than what the wizard sets up by default to ensure my settings weren't out of line with what I'd expect the average user to have.
What are the default blocklists that you keep referring to? I've used pfBlockerNG for years and have never seen any default blocklists. In the -Devel version of pfBlockerNG, he added some lists so new folks wouldn't have to search the internet for lists to use, but I wouldn't call them default lists and they are not part of any setup wizard.
I'm not sure what you're issue is. PfBlockerNG works for me and the majority of other seasoned users.
-
@jdeloach https://i.imgur.com/T9Cz239.png
Anything with a check mark was enabled by the wizard during the initial setup. As you can see, I've turned off most of them.
It's nice to know that most users do not have this issue. It's never fun being an edge case, but clearly I'm not the only one with the issue.
I'd be interested to know if @Frosch1482 also has an Nvidia Shield TV, perhaps even a 2015 model, on their network.
-
@Cool_Corona said in PfBlockerNG high CPU:
states
Hello!
When the states spike can you look at the Diagnostics -> States Summary and see which IP(s) have all the states open?
John
-
@lunaticfringe80 said in PfBlockerNG high CPU:
@jdeloach https://i.imgur.com/T9Cz239.png
Anything with a check mark was enabled by the wizard during the initial setup. As you can see, I've turned off most of them.
It's nice to know that most users do not have this issue. It's never fun being an edge case, but clearly I'm not the only one with the issue.
I'd be interested to know if @Frosch1482 also has an Nvidia Shield TV, perhaps even a 2015 model, on their network.
You only get the check mark if you select the list. If you are clicking on all the lists that are in the Feeds menu, then I can see why you are having problems. You are not supposed to select all the lists. That is not the intent of the list being provided.
Some of those lists are huge, a majority are in the 700K-800K size each which take a lot of processing time to sort each time a new URL/IP is reached. -
@serbus When I viewed the states last night in the middle of a spike I did not notice anything unusual in regards to host traffic but I did see activity on the loopback interface that I was unfamiliar with. Viewing the states now while there is no spike I am noticing far fewer of those lo0 entries.
They look like this: lo0 udp ::1[14447] -> ::1[33159]
-
@jdeloach said in PfBlockerNG high CPU:
@lunaticfringe80 said in PfBlockerNG high CPU:
@jdeloach https://i.imgur.com/T9Cz239.png
Anything with a check mark was enabled by the wizard during the initial setup. As you can see, I've turned off most of them.
It's nice to know that most users do not have this issue. It's never fun being an edge case, but clearly I'm not the only one with the issue.
I'd be interested to know if @Frosch1482 also has an Nvidia Shield TV, perhaps even a 2015 model, on their network.
You only get the check mark if you select the list. If you are clicking on all the lists that are in the Feeds menu, then I can see why you are having problems. You are not supposed to select all the lists. That is not the intent of the list being provided.
Some of those lists are huge, a majority are in the 700K-800K size each which take a lot of processing time to sort each time a new URL/IP is reached.I suggest you try setting it up using the wizard to see for yourself that no selection by the user is necessary for those lists to be enabled.
I've just tested it again by unchecking the box to save settings and unchecked the box so pfblockerng will be disabled. I clicked save at the bottom of the page. Then I uninstalled pfblockerng-devel using the package manager page. Then I installed pfblockerng-devel again. I selected pfblockerng from the firewall menu. It brought me to the wizard where I clicked next only changing one thing, the VIP address, and then after it completed the below linked image is what I see for feeds:
https://i.imgur.com/7ie1NU0.png
-
Okay, I stand corrected. That drop down labeled Wizard must be something new that was added recently for the newbies using pfBlockerNG. I've never seen that before and I doubt any of us that have used this package for years and years would ever use that.
But if you had read the note, highlighted in red, at the bottom of the blue box at top of the Feeds list, you would have seen where it tells you to NOT ENABLE all the Feeds. When using the Wizard, if it does enable all the Feeds like you say, you need to point that out to the maintainer of the package, @BBcan177, so he can fix that. I don't think that is what he intended for folks to do and will potentially cause the issues that you are seeing.
-
All the feeds were not enabled. Not even half of them are enabled. The wizard, which comes up automatically upon first going to pfblockerng post install, enables just those few.
To rule out whether it's the amount of blocked domains in total, or just the volume of blocked requests at the time, I will see if I can only block the aforementioned worst offender after I confirm that allowing that domain makes the performance impact disappear.
The problem has just resurfaced after completely uninstalling and reinstalling pfblockerng-devel for the previous demonstration. I expect the next spike to happen in about 15mins. I will report my findings.
-
Adding that domain to the whitelist during a spike was enough to return performance to normal. So I think that's enough to safely say the spikes result from blocking queries. The second part, whether the overall performance impact depends on the total size of the blocklist, I was not able to determine for 2 reasons.
-
I couldn't find where to simply add a single domain to the blocklist.
Please advise the simplest way to do that. -
Once I allowed the device to reach the domain, it stops continually trying, which makes sense. It's only trying over and over because it fails, obviously.
If someone can help with #1, I can rule out the second part when the device decides to phone in metrics again.edit: I figured out where to add a custom blocklist. Now we wait for the Shield to do it's thing.
-
-
Can confirm, no difference in performance with a blocklist of 1, versus the ~160,000 domains the wizard sets it up with.

The first blue mark before 0200 is when I whitelisted the troublesome domain causing no further performance issues.
The second blue mark is after I had done a fresh reinstall of pfblockerng-devel, waited for the spikes to come, then I whitelisted that same domain in the middle of a spike causing it to stop immediately.
After that I did a fresh reinstall of pfblockerng-devel, but this time opted out of the wizard and added just a single domain to a custom blocklist. At about 1700 you can see the spike returns and performance impact is no different.
Here you can see both the scale of the queries and that there's only 1 domain:

Can you guys confirm that this is line with what is to be expected for DNS sinkholing performance from pfblockerng? If this is a bug I'd be happy to continue testing and providing any helpful data I can. If this is working as intended, I'll just move on to another solution and quit bothering you guys.
-
You've probably a device that tests if it has a 'Internet' connection, and if so, it (tries to) resolves a host name, like "update.device-brand.tld".
If that fails - because the answer it received was "10.10.10.1" (the default internal pfBlockerNG build in webserver ) it will fail to connect to what it wants : the device's update server at "update.device-brand.tld".
It could be stupid, and re try, using the same host name, or another host name from an internal, build in list. Let's face it, some appliances coded in "the east" are not coded as appliances coded in "the west" (from where I'm based ^^).@lunaticfringe80 said in PfBlockerNG high CPU:
then I whitelisted that same domain in the middle of a spike causing it to stop immediately.
Just to be sure : you do see the Firewall >= pfBlockerNG =>Alerts and on that page, somewhat mower : DNSB, getting populated with blocked domain names ?
@lunaticfringe80 said in PfBlockerNG high CPU:
If this is working as intended, I'll just move on to another solution and quit bothering you guys.
Your kidding ?

This is a 'free' forum : no one has to reply here. Those who do are all looking for the same thing : it's not about you being right or wrong, or us. Just all of us trying to understands what happens. If an issue can be found, it could be corrected and everybody will benefit from it. -
I'm not at home these days. But i can confirm that I have a nvidia shield as well.
Regarding IoT devices I have a very easy setup. Isolated network with dns 1.1.1.1 configured in the dhcp server. Therefore the IoT devices should not be filtered by pfblockerng. Openly speaking I don't really care if they phone home and send metrics.
Pfblockerng is used only to protect my "normal devices" and to avoid seeing annoying ads.
Devices: approx 10 IoT and 10 "normal devices"
When I'm back from my vacation I will come back to the topic. There are a few interesting hints I want to check. Thank you guys!
-
@Gertjan said in PfBlockerNG high CPU:
You've probably a device that tests if it has a 'Internet' connection, and if so, it (tries to) resolves a host name, like "update.device-brand.tld".
If that fails - because the answer it received was "10.10.10.1" (the default internal pfBlockerNG build in webserver ) it will fail to connect to what it wants : the device's update server at "update.device-brand.tld".
It could be stupid, and re try, using the same host name, or another host name from an internal, build in list. Let's face it, some appliances coded in "the east" are not coded as appliances coded in "the west" (from where I'm based ^^).The device continues to function without issue while the domain is sinkholed. Updates work and it's able to reach all my streaming services and play content fine.
Just to be sure : you do see the Firewall >= pfBlockerNG =>Alerts and on that page, somewhat mower : DNSB, getting populated with blocked domain names ?
I definitely see entries on the alerts page. Here's an example:

I found an acceptable workaround yesterday that may indicate where the problem is. Rather than set the sinkhole IP to an actual address, I copied what Pihole does and set it to 0.0.0.0 instead. This completely fixed the performance problem. There were no spikes in CPU usage or state table usage at all. This also made all the logging and beautiful alerts and stats in pfblockerng stop working, but the DNS sinkhole continued to function as usual. I was actually able to set the VIP to a proper address and then force reload dnsbl to get the above image just minutes ago.
This is an acceptable workaround for the time being, but I'd still like to figure out the problem. The fact that @Frosch1482 confirmed they also have an Nvidia Shield indicates this will be a problem for owners of that device. I mistakenly said it was my 2015 model previously, but I've since realized it my newer 2019 Pro model at fault here.
How does pfblockerng handle that VIP address? Since all the logging stops when I set it to 0.0.0.0, I assume it is either listening on the VIP address to receive this data or watching for requests to route to that non-existent private network. So it's not logging DNS queries like pihole does, but actual packets that are destined for that VIP address, right? The performance issue has to be somewhere in that process, but since I've only been using pfsense for less than a month, I'm at the limit of my knowledge.
-
Just in case you haven't seen this, you might give it a look as to how to setup pfBlockerNG with DNSBL: https://linuxincluded.com/block-ads-malvertising-on-pfsense-using-pfblockerng-dnsbl/
-
Hello!
@lunaticfringe80 Is your pfb dnsbl vip and network devices in the same subnet? The default vip is 10.10.10.1 and it looks like shield1 is at 10.10.10.32. It might not be an issue, but the pfb dnsbl vip instructions do say, "This address should be in an Isolated Range that is not used in your Network."
John
-
@serbus said in PfBlockerNG high CPU:
Hello!
@lunaticfringe80 Is your pfb dnsbl vip and network devices in the same subnet? The default vip is 10.10.10.1 and it looks like shield1 is at 10.10.10.32. It might not be an issue, but the pfb dnsbl vip instructions do say, "This address should be in an Isolated Range that is not used in your Network."
John
My network is 10.10.10.0/25 so I've been using something like 10.222.222.1 for the VIP address. I mentioned in posts above that I changed it from default, but this thread has gotten long so I can't blame you for not seeing that.
For good measure I've just tested it using a completely different private network class by using 172.31.250.250 and it's the same performance problem as when I have it set to 10.222.222.1.
-
Hello!
Oh, sorry I missed that...
I am not an expert on any of this, but what you are seeing is not normal for any of my networks that are running similar setups with pfb and 10-20 devices. I am running the straight, stock pfb dnsbl feed config. There are normally 600-1200 states active throughout the day. That spike to 14-15k states just doesn't look right. The States Summary table should show you total state counts for each local/remote ip. Do have a bunch of IPs with hundreds of states open, or a couple of IPs with thousands? Maybe a single rogue device opening almost all of them? That is where I would start looking...
John