How do I interpret these status graphs in pfBlockerNG?
-
What do these two indicators mean?
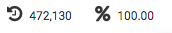
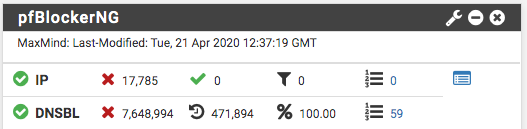
I've read the mouse-over text but I don't fully understand what these mean and the implications of them.These are part of the status bar for pfBlockerNG
Thanks!
-
Hello,
For line IP :it means : pfblocker block 17.785 IP address , 0 ip for "pass rule" , and 0 ip with "match rule" (match rule just log, don't block) , 0 ip in the exclusion list (suppression list).
for line dnsbl :
7.648.994 dns query have been blocked , 471894 query have been made ... so % of blocked query is above 100 % lol (not normal , maybe reset stats can help , you can at least reset "states" at the bottom of IP page of pfblocker by ticking/unticking this option ... it will release all blocked ip) , and 59 domain are excluded from filter ...
the real value of % blocked query with your exemple is : 7648994 / 471.894 * 100 = 1620%
A really blocker pfsense !
have nice days !
-
This post is deleted! -
@maba
Thank you. Makes sense. Just found the button to clear out the counters and reset them!