host traffic monitoring with iftop, telegraf and influx (and grafana)
-
Hi there -
I spent some time looking through different solutions for host traffic monitoring. Eventually, I put something together that was simple that I thought I'd share. It uses iftop, telegraf, influx and grafana to give me host traffic flows. The basic idea is that every so often telegraf will run a script that calls iftop and then I scrape the results and put them in the right influx line format. I figured others might have feedback or use for this.
Here's the code on github.
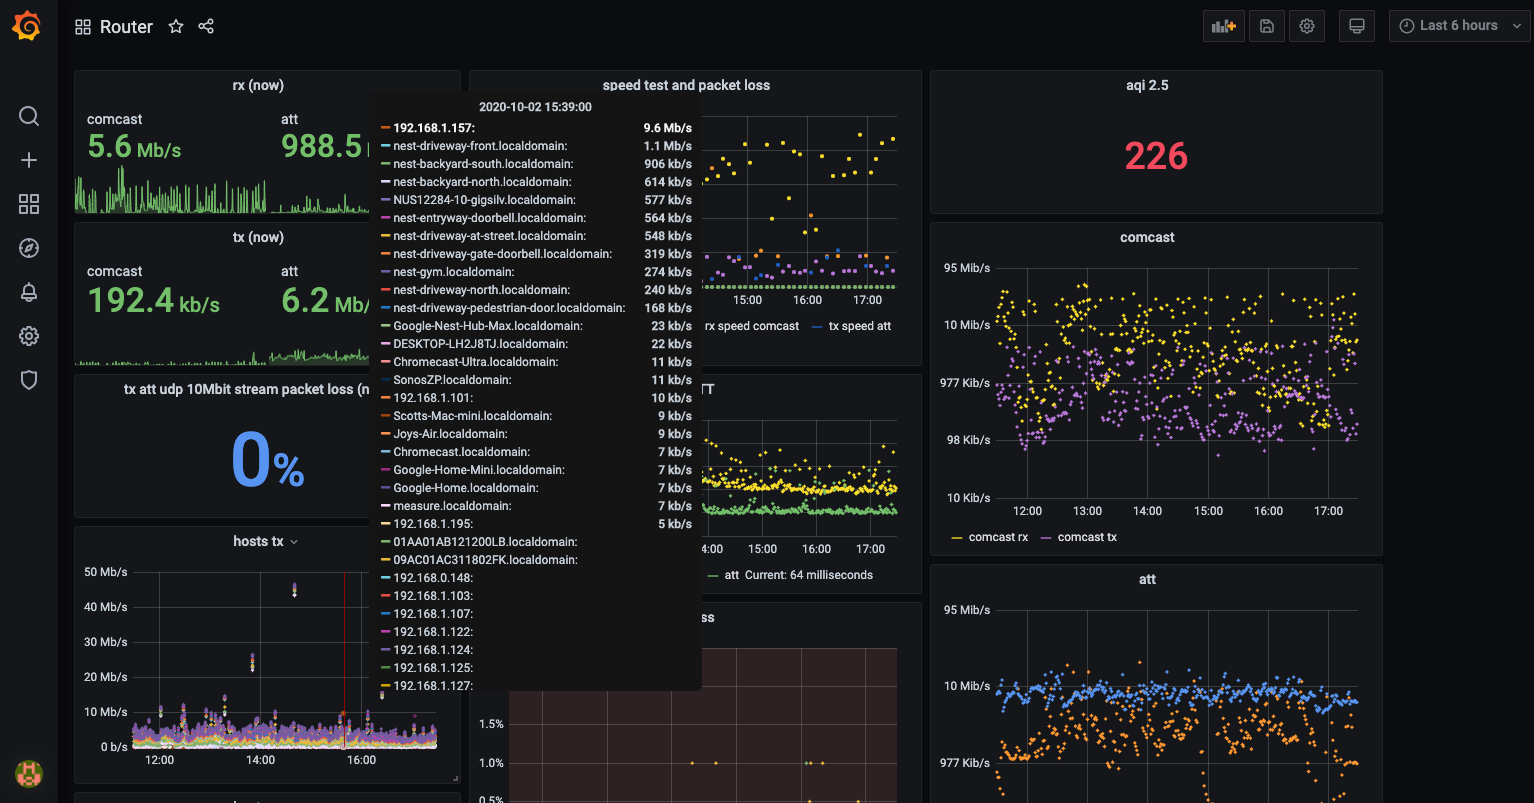
Here's a picture of a graph, showing the host breakdown (in the bottom left corner)
Comments, feedback, contributions welcome.
Thanks,
Scott
More background if you care...
I'm still a newbie to pfSense and to influx queries. I did go down the path of ntopng to telegraf for a while but found I was spending lots of time figuring out how to get hostnames, etc. And ultimately I was replicating the Status Graph in pfSense. So I decided I liked that and just replicated it by sampling iftop and putting those data into influx via telegraf.
Also note you will need telegraf. I used to use a Netgate 3100 but eventually I gave up because not enough packages were available for it (it's 32 bit ARM). And I spent forever trying to compile stuff for it. Telegraf is based on go, for which there is no 32 bit ARM FreeBSD package for that I could find nor could I get to compile.
-
@scottmsilver your json code for the grafana is missing
-
@pfsense99 Do you mean for the dashboard? I didn't provide any dashboard set-up as once the data are in influx it's a pretty typical setup. Let me know if I misunderstood your question.
-
@scottmsilver yes - the json dashboard - you can export it. Looked at your github and did not see the export grafana json file
-
@pfsense99 Sure. I'll post it ;-)
-
@scottmsilver thanks - was wondering what is your Y axis - e.g. datarate bytes/sec(SI) and if you using linear or log(2) for the scale
-
@pfsense99 it's data rate bits per second and it's linear.