Traffic Totals off by hours
-
The Traffic Totals are off by a few hours.
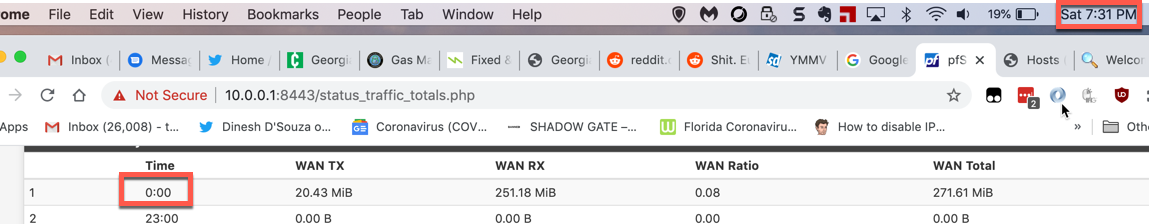
The Status / Dashboard shows the time is correct but when I check the hourly view, it shows 0:00 at 7:31pm
-
UTC vs local time maybe? Do you have the time zone in pfSense set to the correct time zone? (System > General Setup)
-
yes and it shows the correct time on the status page and from the shell
[2.4.5-RELEASE][root@pfSense.localdomain]/root: date
Sun Oct 11 18:15:05 EDT 2020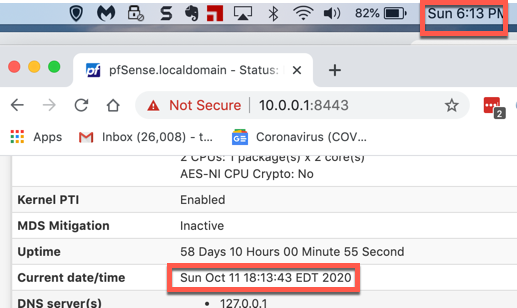
-
Could be an issue with the package... I know there are other issues regarding date/time (like transitions between Daylight Savings and Standard time)...
After resetting the data on mine (there was something somewhere that had horribly messed up the hourly data), mine's showing 12 hours off (I'm also EDT)... the graph is showing 10/11/2020 6:00 instead of 18:00!
Oddly, when I do
vnstat -hgfrom the console, it shows 18:00... so yeah, looks like it's something in the package code. Again, not the first time there have been issues. Unfortunately the package appears to be stale... there are a number of issues for it open in Redmine, some for a couple of years.Edit to add: And now, after the hour change, it's showing as 17:00 instead of 19:00. I suppose I can attribute one hour of the difference to Daylight Savings Time (standard is GMT-5, daylight is GMT-4)... but not sure where the second hour is coming from.
-
I mostly use it to monitor my data when I get close to the end of the month to make sure I'm not exceeding the Comcast 1.2 TB limit.
Is there a better package to use?
-
As far as just a basic traffic monitor for interfaces on pfSense? This is probably the best. Others do a lot more, like tracking individual hosts/devices, what they're connecting to, etc. and might not track the interface as a whole.
To be honest, as long as you know the time difference, it's still doing what it should be doing. Plus, while my hourly graph seems to be horribly screwed up (it's showing that the current hour is 10/22/2020 11:00 AM), the daily and monthly graphs seem to be fine. And it's that monthly graph that you'd be most concerned about when checking against a data cap.