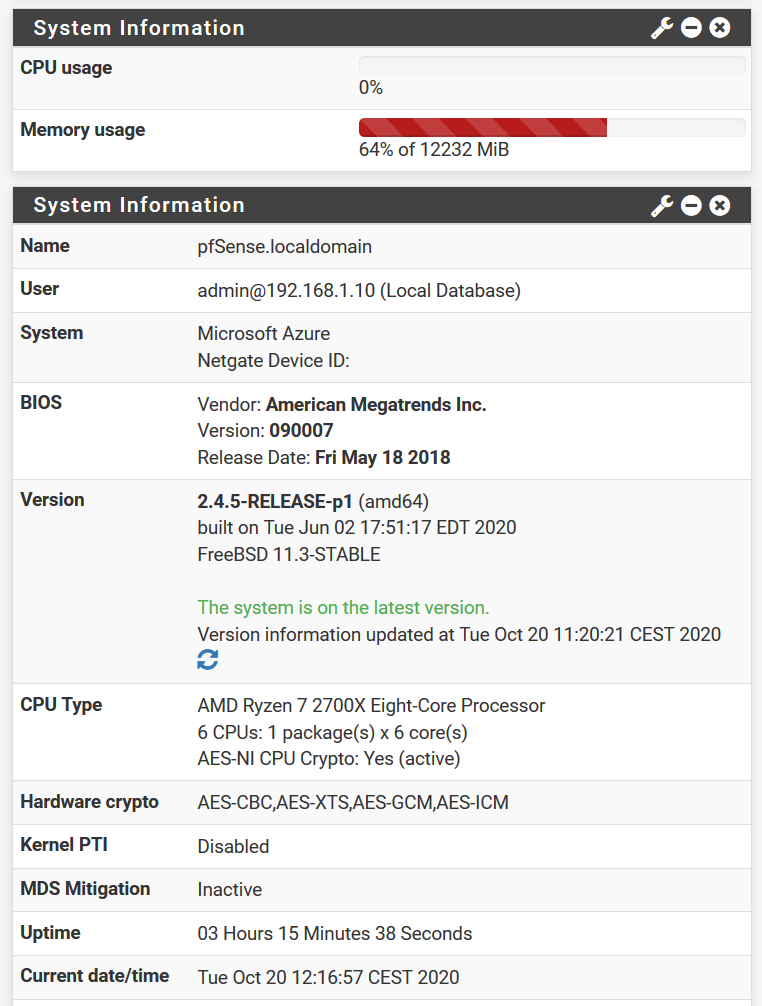
Suricata - sometimes high memory usage
-
I noticed from time to time that suricata is not releasing memory on its own.
It is almost double the normal usage and could go even higher.Is there maybe an option to reduce this memory footprint?
Suricata 5.0.3 in legacy mode running on five interfaces on 2.4.5-RELEASE-p1 in hyper-v.
Shell Output - top -o res

last pid: 66162;  load averages:  0.27,  0.37,  0.68  up 0+03:08:36    12:09:55
89 processes:  1 running, 88 sleeping

Mem: 5569M Active, 142M Inact, 1295M Laundry, 878M Wired, 180M Buf, 4039M Free
Swap: 4096M Total, 405M Used, 3690M Free, 9% Inuse


  PID USERNAME    THR PRI NICE   SIZE    RES STATE   C   TIME    WCPU COMMAND
45332 root         12  20    0  4858M  2621M nanslp  5   6:11   0.00% suricata
60888 root         12  20    0  4660M  2524M nanslp  1   4:33   0.00% suricata
48894 root         12  20    0   648M   426M nanslp  5   1:05   0.00% suricata
71520 root         12  20    0   656M   307M nanslp  4   1:04   0.00% suricata
79215 root         12  20    0   642M   305M nanslp  1   1:04   0.00% suricata
17687 unbound       6  20    0   145M 78684K kqread  0   0:12   0.00% unbound
82624 root          1  20    0 54336K 28632K piperd  3   0:00   0.00% php_pfb
83696 root          1  20    0 52224K 28488K piperd  5   0:00   0.00% php
83907 root          1  52    0 52224K 28032K piperd  0   0:00   0.00% php
  345 root          1  24    0    98M 26168K piperd  3   0:28   0.98% php-fpm
16765 root          1  52    0    98M 23280K accept  0   0:25   0.00% php-fpm
25599 root          1  52    0    98M 23252K accept  0   0:25   0.00% php-fpm
85559 root          1  52    0    98M 23248K accept  5   0:25   0.00% php-fpm
55352 root          1  52    0    98M 23148K accept  0   0:24   0.00% php-fpm
79589 root          1  52    0    98M 22960K accept  3   0:28   0.00% php-fpm
16814 root          1  52    0    98M 22856K accept  4   0:28   0.00% php-fpm
  343 root          1  20    0 95212K 17392K kqread  3   0:00   0.00% php-fpm
21161 dhcpd         1  20    0 16464K  9220K select  0   0:01   0.00% dhcpd
-
Looking now, the usage is down again to the normal state, haven't changed anything and don't know when it went down, but it looks to me, that it takes to long.

-
Several things can cause this. For starters, I see you are running five instances of Suricata on an 8-core CPU. That is going to chew up a lot of TCP stream memcap space right out of the gate, and that's before any rules are even loaded. Second, the amount of RAM Suricata uses is impacted by traffic flow. When there is lots of traffic, Suricata will be opening multiple TCP flows and tracking them. Each of those takes RAM. When the flows close (or timeout, if the hosts don't close them all properly), Suricata will expire the flow tracking and release that memory.
When "Live Rule Swapping" is enabled, Suricata can briefly consume almost double the normal RAM as it load two copies of the enabled rules into memory ( the old ones and the incoming new ones) while installing the updated rules.
Finally, the Suricata binary is a complex piece of software and the upstream developers are constantly finding memory-related bugs and fixing them. You can cruise over and visit their Redmine Site to review existing and previous bug reports.
IDS/IPS packages are by design going to be memory hogs. That's why I encourage folks to pick and choose their rules wisely so as not to waste CPU and RAM testing against rules that will never trigger in their network. And carefully consider how many instances of the IDS/IPS package you actually deploy on your firewall. Perhaps you really only need one or two instead of many.
-
@bmeeks Thank you. Live rule swapping is not active and at the time of the screenshot there was almost no traffic. So I guess it is "bugs" and "virtualization".
I run so many because I don't like the flood of alerts, when it runs on WAN and I made a DMZ for every server that I run at home and also I like Suricata blocking the MS telemetry. But I noticed that on a vlan, I only have to run it on the parent interface and not on all vlans separately.
